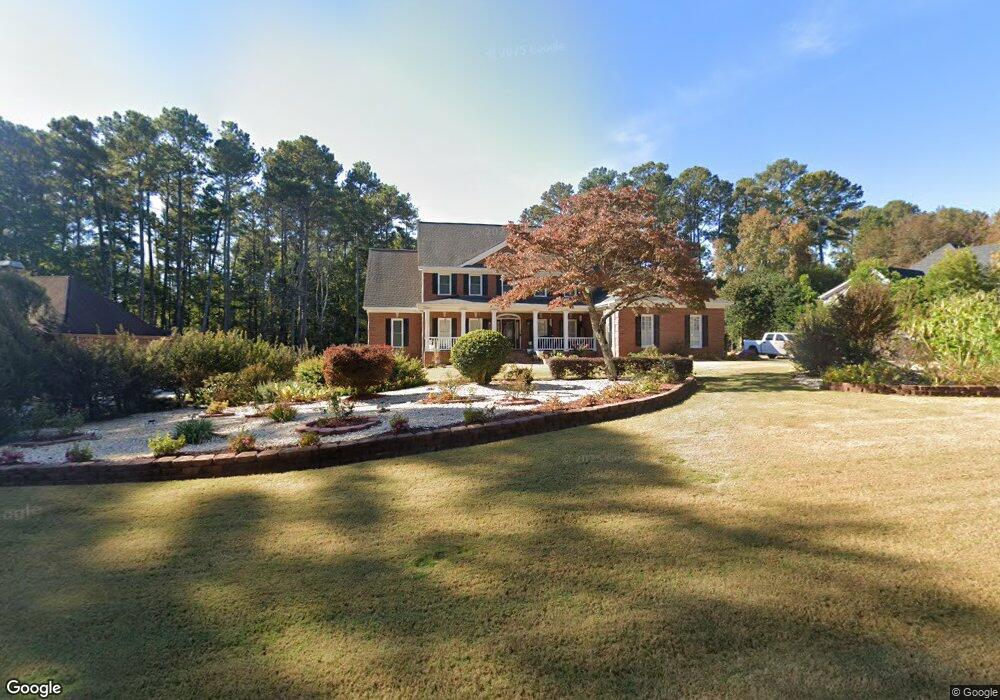
1671 Canterbury Pointe SE Unit 1 Conyers, GA 30013
Estimated Value: $405,000 - $504,000
4
Beds
4
Baths
2,894
Sq Ft
$159/Sq Ft
Est. Value
About This Home
This home is located at 1671 Canterbury Pointe SE Unit 1, Conyers, GA 30013 and is currently estimated at $460,249, approximately $159 per square foot. 1671 Canterbury Pointe SE Unit 1 is a home located in Rockdale County with nearby schools including Flat Shoals Elementary School, Memorial Middle School, and Salem High School.
Ownership History
Date
Name
Owned For
Owner Type
Purchase Details
Closed on
Jul 16, 2001
Sold by
Hendrix Stephen L and Hendrix Karen
Bought by
Stoute Angela and Stoute Stephen J
Current Estimated Value
Purchase Details
Closed on
Jun 30, 2000
Sold by
Rouse Russell V and Rouse Shirley J
Bought by
Hendrix Stephen L and Hendrix Karen
Home Financials for this Owner
Home Financials are based on the most recent Mortgage that was taken out on this home.
Original Mortgage
$250,000
Interest Rate
8.54%
Mortgage Type
New Conventional
Purchase Details
Closed on
Jun 30, 1994
Sold by
Falcon Devel Inc
Bought by
Rouse Russell Shirley
Home Financials for this Owner
Home Financials are based on the most recent Mortgage that was taken out on this home.
Original Mortgage
$203,000
Interest Rate
8.51%
Create a Home Valuation Report for This Property
The Home Valuation Report is an in-depth analysis detailing your home's value as well as a comparison with similar homes in the area
Home Values in the Area
Average Home Value in this Area
Purchase History
| Date | Buyer | Sale Price | Title Company |
|---|---|---|---|
| Stoute Angela | $325,000 | -- | |
| Hendrix Stephen L | $312,500 | -- | |
| Rouse Russell Shirley | $275,000 | -- |
Source: Public Records
Mortgage History
| Date | Status | Borrower | Loan Amount |
|---|---|---|---|
| Previous Owner | Hendrix Stephen L | $250,000 | |
| Previous Owner | Rouse Russell Shirley | $203,000 |
Source: Public Records
Tax History Compared to Growth
Tax History
| Year | Tax Paid | Tax Assessment Tax Assessment Total Assessment is a certain percentage of the fair market value that is determined by local assessors to be the total taxable value of land and additions on the property. | Land | Improvement |
|---|---|---|---|---|
| 2024 | $4,640 | $210,800 | $37,800 | $173,000 |
| 2023 | $3,819 | $187,080 | $34,920 | $152,160 |
| 2022 | $3,843 | $175,760 | $34,920 | $140,840 |
| 2021 | $3,287 | $145,480 | $24,080 | $121,400 |
| 2020 | $3,330 | $141,640 | $24,560 | $117,080 |
| 2019 | $2,797 | $121,280 | $15,000 | $106,280 |
| 2018 | $2,724 | $118,360 | $15,000 | $103,360 |
| 2017 | $2,666 | $115,400 | $15,000 | $100,400 |
| 2016 | $2,029 | $101,800 | $15,880 | $85,920 |
| 2015 | $2,029 | $101,800 | $15,880 | $85,920 |
| 2014 | $1,686 | $99,320 | $13,400 | $85,920 |
| 2013 | -- | $111,360 | $24,000 | $87,360 |
Source: Public Records
Map
Nearby Homes
- 2791 Wellington Way SE Unit 1
- 2561 Old Salem Cir SE
- 3095 Brombley Dr SE
- 2405 Old Salem Rd SE Unit 1
- 2365 Brentmoore Point Unit 3
- 2052 Evergreen Dr SE
- 1613 Brentwood Crossing SE Unit 3
- 1180 Azalea Cir SE
- 1260 Sweet Shrub Ln SE
- 2303 Deerfield Chase SE Unit 5
- 3111 Green Gate Way SE
- 3639 Cape Ln
- 2320 Deerfield Chase SE Unit 5
- 1646 Ellington Rd SE
- 1135 Vineyard Dr SE
- 2259 Old Salem Rd SE
- 2585 Westchester Way SE
- 2235 Kings Forest Dr SE
- 1691 Canterbury Point
- 1691 Canterbury Pte
- 1691 Canterbury Pointe SE
- 1661 Canterbury Pointe SE Unit 1
- 1651 Canterbury Pointe SE
- 1670 Canterbury Pointe SE
- 1701 Canterbury Point
- 2661 Wellington Way SE
- 1730 Stratford Crossing SE
- 1720 Stratford Crossing SE Unit 2
- 1730 Stratford Crossing SE Unit 2
- 2671 Wellington Way SE
- 1670 Canterbury Pointe SE
- 1670 Canterbury Pointe SE Unit 11
- 1660 Canterbury Point
- 1660 Canterbury Point Unit 1
- 1660 Canterbury Pointe SE
- 1670 Canterbury Point Unit 1
- 1690 Canterbury Pointe SE
- 1740 Stratford Crossing SE Unit 2