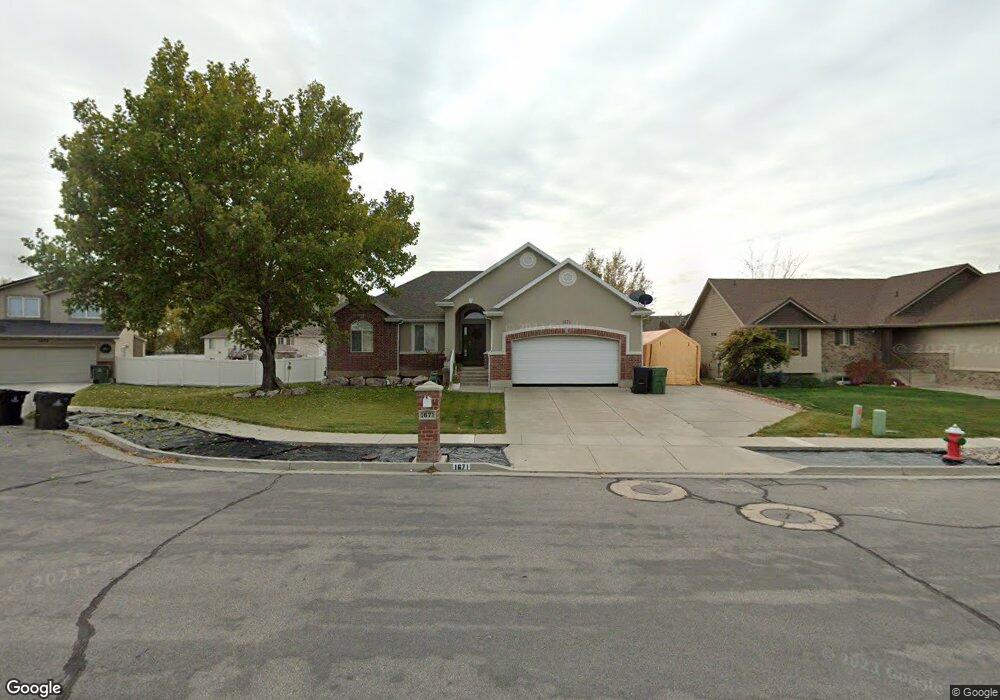
1671 W 2000 S Syracuse, UT 84075
Estimated Value: $528,000 - $566,000
3
Beds
2
Baths
3,024
Sq Ft
$180/Sq Ft
Est. Value
About This Home
This home is located at 1671 W 2000 S, Syracuse, UT 84075 and is currently estimated at $544,742, approximately $180 per square foot. 1671 W 2000 S is a home located in Davis County with nearby schools including Cook School, Syracuse Junior High School, and Syracuse High School.
Ownership History
Date
Name
Owned For
Owner Type
Purchase Details
Closed on
Jul 2, 2025
Sold by
David D Newton Separate Property Trust and Newton David D
Bought by
Newton Family Revocable Living Trust and Newton
Current Estimated Value
Purchase Details
Closed on
Feb 4, 2008
Sold by
Newton Sharon Wilson
Bought by
Newton David D
Purchase Details
Closed on
Mar 1, 2006
Sold by
Wilson Sharon B
Bought by
Newton David D
Purchase Details
Closed on
May 15, 2002
Sold by
Rainey Homes Inc
Bought by
Shupe Casy J and Shupe Sharree S
Home Financials for this Owner
Home Financials are based on the most recent Mortgage that was taken out on this home.
Original Mortgage
$133,300
Interest Rate
6.62%
Purchase Details
Closed on
Jan 28, 2002
Sold by
Buttars Larry M and Calver Christine H
Bought by
Rainey Homes Inc
Home Financials for this Owner
Home Financials are based on the most recent Mortgage that was taken out on this home.
Original Mortgage
$138,464
Interest Rate
7.17%
Mortgage Type
Construction
Create a Home Valuation Report for This Property
The Home Valuation Report is an in-depth analysis detailing your home's value as well as a comparison with similar homes in the area
Home Values in the Area
Average Home Value in this Area
Purchase History
| Date | Buyer | Sale Price | Title Company |
|---|---|---|---|
| Newton Family Revocable Living Trust | -- | None Listed On Document | |
| Newton David D | -- | None Available | |
| Newton David D | -- | None Available | |
| Newton David D | -- | Accommodation | |
| Wilson Sharon B | -- | First American Title | |
| Shupe Casy J | -- | Heritage West Title Insuranc | |
| Rainey Homes Inc | -- | Heritage West Title Insuranc |
Source: Public Records
Mortgage History
| Date | Status | Borrower | Loan Amount |
|---|---|---|---|
| Previous Owner | Shupe Casy J | $133,300 | |
| Previous Owner | Rainey Homes Inc | $138,464 | |
| Closed | Shupe Casy J | $25,000 |
Source: Public Records
Tax History Compared to Growth
Tax History
| Year | Tax Paid | Tax Assessment Tax Assessment Total Assessment is a certain percentage of the fair market value that is determined by local assessors to be the total taxable value of land and additions on the property. | Land | Improvement |
|---|---|---|---|---|
| 2025 | $278 | $267,300 | $123,707 | $143,593 |
| 2024 | $345 | $269,500 | $101,129 | $168,371 |
| 2023 | $2,684 | $475,000 | $140,978 | $334,022 |
| 2022 | $2,862 | $277,750 | $81,315 | $196,435 |
| 2021 | $494 | $381,000 | $120,031 | $260,969 |
| 2020 | $2,269 | $330,000 | $105,154 | $224,846 |
| 2019 | $2,187 | $314,000 | $102,057 | $211,943 |
| 2018 | $2,042 | $291,000 | $98,955 | $192,045 |
| 2016 | $1,812 | $135,410 | $38,008 | $97,402 |
| 2015 | $1,772 | $126,115 | $38,008 | $88,107 |
| 2014 | $1,661 | $120,493 | $38,008 | $82,485 |
| 2013 | -- | $121,734 | $32,571 | $89,163 |
Source: Public Records
Map
Nearby Homes