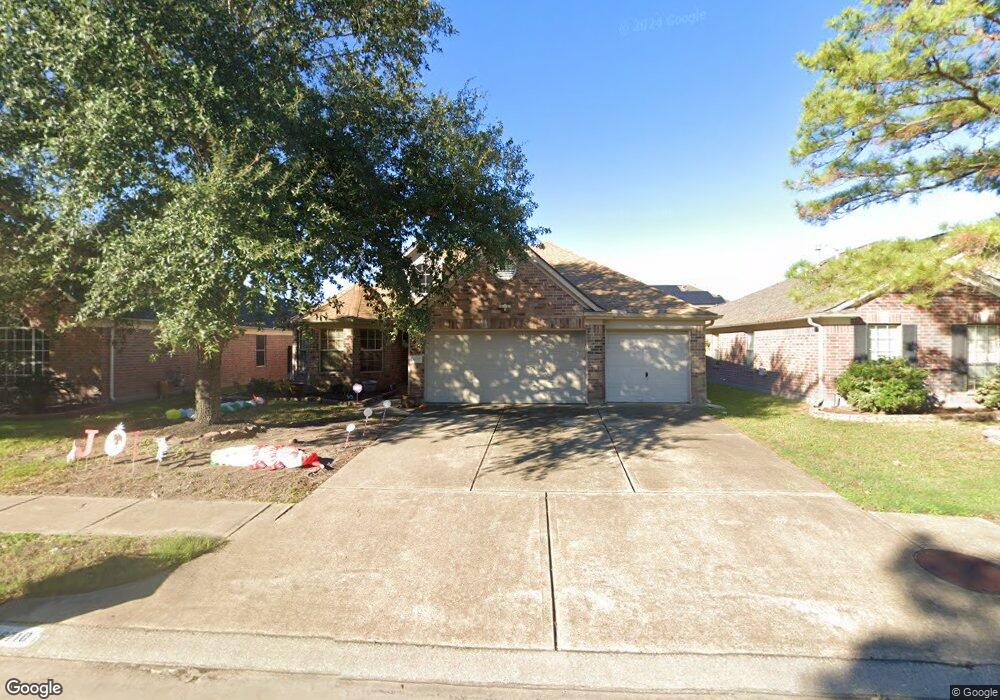
16710 Spring Glade Dr Cypress, TX 77429
Estimated Value: $291,000 - $314,000
3
Beds
2
Baths
1,977
Sq Ft
$153/Sq Ft
Est. Value
About This Home
This home is located at 16710 Spring Glade Dr, Cypress, TX 77429 and is currently estimated at $301,902, approximately $152 per square foot. 16710 Spring Glade Dr is a home located in Harris County with nearby schools including Farney Elementary School, Goodson Middle, and Cypress Woods High School.
Ownership History
Date
Name
Owned For
Owner Type
Purchase Details
Closed on
Apr 29, 2015
Sold by
Rutland Byron and Rutland Kelley
Bought by
Phan Quoc and Phan Sylvie
Current Estimated Value
Home Financials for this Owner
Home Financials are based on the most recent Mortgage that was taken out on this home.
Original Mortgage
$172,059
Outstanding Balance
$132,884
Interest Rate
3.75%
Mortgage Type
FHA
Estimated Equity
$169,018
Purchase Details
Closed on
Jun 27, 2005
Sold by
Metcalf Cody G
Bought by
Rutland Byron
Home Financials for this Owner
Home Financials are based on the most recent Mortgage that was taken out on this home.
Original Mortgage
$112,000
Interest Rate
5.67%
Mortgage Type
Fannie Mae Freddie Mac
Purchase Details
Closed on
Dec 20, 2001
Sold by
Long Lake Ltd
Bought by
Metcalf Cody G
Home Financials for this Owner
Home Financials are based on the most recent Mortgage that was taken out on this home.
Original Mortgage
$126,758
Interest Rate
6.41%
Mortgage Type
FHA
Create a Home Valuation Report for This Property
The Home Valuation Report is an in-depth analysis detailing your home's value as well as a comparison with similar homes in the area
Home Values in the Area
Average Home Value in this Area
Purchase History
| Date | Buyer | Sale Price | Title Company |
|---|---|---|---|
| Phan Quoc | -- | Providence Title Co | |
| Rutland Byron | -- | Southern American Title West | |
| Metcalf Cody G | -- | American Title Co |
Source: Public Records
Mortgage History
| Date | Status | Borrower | Loan Amount |
|---|---|---|---|
| Open | Phan Quoc | $172,059 | |
| Previous Owner | Rutland Byron | $112,000 | |
| Previous Owner | Metcalf Cody G | $126,758 |
Source: Public Records
Tax History Compared to Growth
Tax History
| Year | Tax Paid | Tax Assessment Tax Assessment Total Assessment is a certain percentage of the fair market value that is determined by local assessors to be the total taxable value of land and additions on the property. | Land | Improvement |
|---|---|---|---|---|
| 2025 | $4,704 | $278,038 | $64,033 | $214,005 |
| 2024 | $4,704 | $276,902 | $64,033 | $212,869 |
| 2023 | $4,704 | $293,295 | $64,033 | $229,262 |
| 2022 | $6,259 | $268,589 | $53,361 | $215,228 |
| 2021 | $5,956 | $216,523 | $51,421 | $165,102 |
| 2020 | $5,776 | $205,226 | $51,421 | $153,805 |
| 2019 | $5,671 | $195,850 | $23,568 | $172,282 |
| 2018 | $1,752 | $183,335 | $23,568 | $159,767 |
| 2017 | $5,402 | $183,335 | $23,568 | $159,767 |
| 2016 | $5,141 | $174,505 | $23,568 | $150,937 |
| 2015 | $4,516 | $167,104 | $23,568 | $143,536 |
| 2014 | $4,516 | $145,957 | $19,589 | $126,368 |
Source: Public Records
Map
Nearby Homes
- 16730 Spring Barker Dr
- 14339 Pelican Marsh Dr
- 14331 Pelican Marsh Dr
- 14434 Glade Point Dr
- 14311 Glade Point Dr
- 16703 Summer Cypress Ct
- 14206 Barker Bayou Ct
- 16318 Cypress Point Dr
- 16306 Cypress Trace Dr
- 16323 Jast Dr
- 16302 Cypress Point Dr
- 14710 Timber Cliff Ln
- 16218 Barklea Rd
- 14631 Timber Cliff Ln
- 14623 Valley Stone Ct
- 16551 Cypress Bridge Dr
- 14806 Cypress Timber Dr
- 16134 Cypress Valley Dr
- 16131 Cypress Point Dr
- 16518 Boston Post Rd
- 16706 Spring Glade Dr
- 16714 Spring Glade Dr
- 16707 Spring Barker Dr
- 16702 Spring Glade Dr
- 16703 Spring Barker Dr
- 16718 Spring Glade Dr
- 16711 Spring Barker Dr
- 16635 Spring Barker Dr
- 16711 Spring Glade Dr
- 16715 Spring Barker Dr
- 16715 Spring Glade Dr
- 16707 Spring Glade Dr
- 16638 Spring Glade Dr
- 16722 Spring Glade Dr
- 16703 Spring Glade Dr
- 16719 Spring Glade Dr
- 16631 Spring Barker Dr
- 16719 Spring Barker Dr
- 16643 Spring Glade Dr
- 16634 Spring Glade Dr