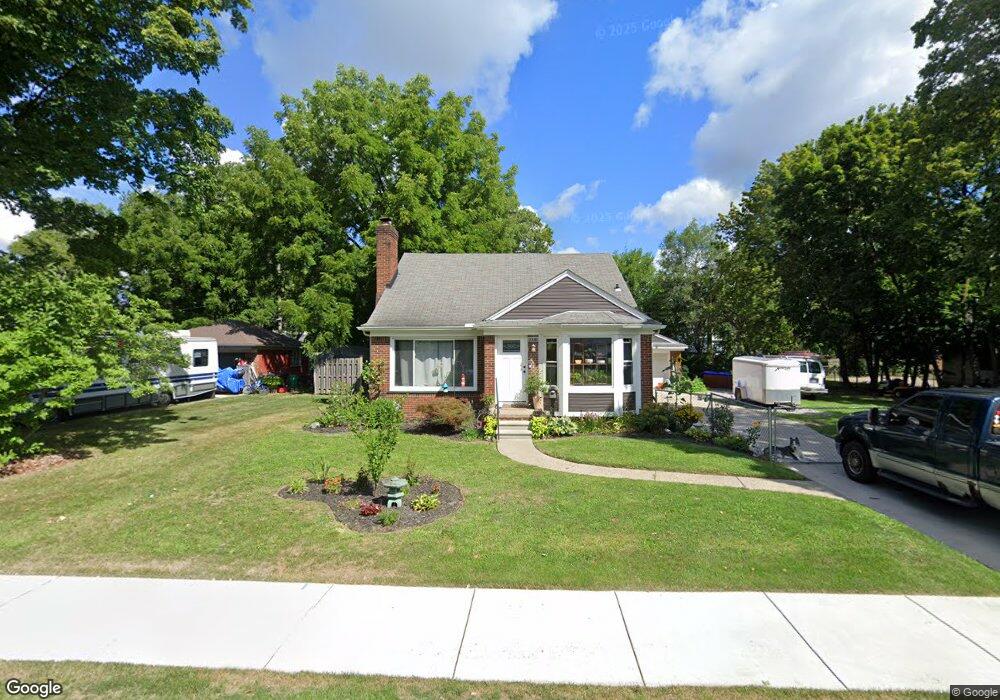
16711 Erin Unit Bldg-Unit Fraser, MI 48026
Estimated Value: $263,000 - $302,000
3
Beds
2
Baths
1,482
Sq Ft
$187/Sq Ft
Est. Value
About This Home
This home is located at 16711 Erin Unit Bldg-Unit, Fraser, MI 48026 and is currently estimated at $277,450, approximately $187 per square foot. 16711 Erin Unit Bldg-Unit is a home located in Macomb County with nearby schools including Ralph Waldo Emerson Elementary School, Richards Middle School, and Fraser High School.
Ownership History
Date
Name
Owned For
Owner Type
Purchase Details
Closed on
Feb 20, 2018
Sold by
Matina Domenico
Bought by
Tuller Trevor Martins
Current Estimated Value
Purchase Details
Closed on
Aug 23, 2017
Sold by
Blue Moon Acquisitions Llc
Bought by
Matina Domenico
Purchase Details
Closed on
Jul 27, 2017
Sold by
Wells Fargo Bank N A
Bought by
Blue Moon Acquisitions Llc
Purchase Details
Closed on
Dec 2, 2016
Sold by
Paola Michael J and Paola Debra A
Bought by
Wells Fargo Bank Na
Create a Home Valuation Report for This Property
The Home Valuation Report is an in-depth analysis detailing your home's value as well as a comparison with similar homes in the area
Home Values in the Area
Average Home Value in this Area
Purchase History
| Date | Buyer | Sale Price | Title Company |
|---|---|---|---|
| Tuller Trevor Martins | $199,900 | Ata National Title Group Llc | |
| Matina Domenico | -- | None Available | |
| Blue Moon Acquisitions Llc | $105,567 | None Available | |
| Wells Fargo Bank Na | $117,260 | None Available |
Source: Public Records
Tax History
| Year | Tax Paid | Tax Assessment Tax Assessment Total Assessment is a certain percentage of the fair market value that is determined by local assessors to be the total taxable value of land and additions on the property. | Land | Improvement |
|---|---|---|---|---|
| 2025 | $5,339 | $135,500 | $0 | $0 |
| 2024 | $52 | $132,500 | $0 | $0 |
| 2023 | $4,991 | $116,600 | $0 | $0 |
| 2022 | $4,908 | $105,600 | $0 | $0 |
| 2021 | $4,854 | $105,000 | $0 | $0 |
| 2020 | $4,681 | $106,100 | $0 | $0 |
| 2019 | $5,379 | $95,100 | $0 | $0 |
| 2018 | $4,460 | $76,500 | $0 | $0 |
| 2017 | $3,061 | $72,266 | $19,827 | $52,439 |
| 2016 | $3,894 | $72,278 | $0 | $0 |
| 2015 | -- | $68,202 | $0 | $0 |
| 2011 | -- | $61,060 | $23,190 | $37,870 |
Source: Public Records
Map
Nearby Homes
- 16572 Rosemary
- 0 14 Mile Rd
- 31745 Schoolcraft
- 33420 Utica Rd
- 15715 Exeter Ct
- 15801 Toulouse Unit 6
- 33530 Utica Rd Unit 9
- 15657 Lauren
- 17689 Masonic
- 33710 Mulvey
- 31674 Grove
- 17548 Adolph
- 15303 Lincolnshire Ln
- 30935 Utica Rd
- 32653 Beacon Ln
- 0 Utica Rd Unit 20251047830
- 18053 Airport
- 34231 Garfield Cir
- 34273 Garfield Cir Unit 5
- 31331 Mc Namee
Your Personal Tour Guide
Ask me questions while you tour the home.