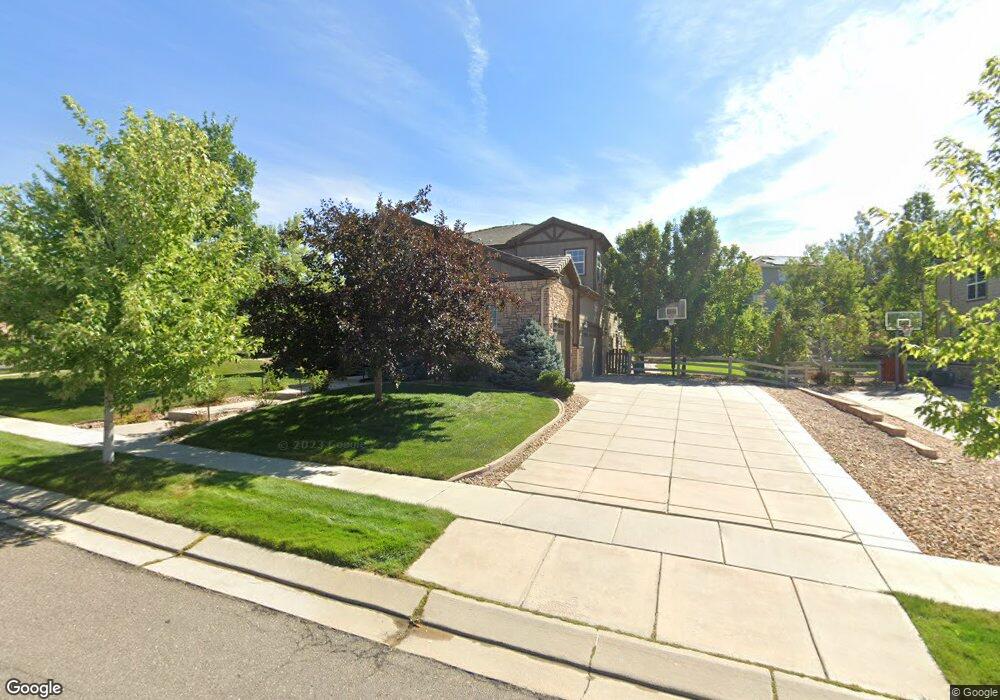
16718 Carson Way Broomfield, CO 80023
Anthem NeighborhoodEstimated Value: $911,000 - $973,000
4
Beds
4
Baths
4,008
Sq Ft
$235/Sq Ft
Est. Value
About This Home
This home is located at 16718 Carson Way, Broomfield, CO 80023 and is currently estimated at $940,632, approximately $234 per square foot. 16718 Carson Way is a home located in Broomfield County with nearby schools including Thunder Vista P-8, Legacy High School, and Prospect Ridge Academy.
Ownership History
Date
Name
Owned For
Owner Type
Purchase Details
Closed on
Apr 30, 2015
Sold by
Thoutt Chad J and Thoutt Virginia M
Bought by
Stack Neal J and Stack Paula C
Current Estimated Value
Home Financials for this Owner
Home Financials are based on the most recent Mortgage that was taken out on this home.
Original Mortgage
$300,000
Outstanding Balance
$232,443
Interest Rate
3.84%
Mortgage Type
New Conventional
Estimated Equity
$708,189
Purchase Details
Closed on
Mar 27, 2008
Sold by
Pulte Home Corp
Bought by
Thoutt Chad J and Thoutt Virginia M
Home Financials for this Owner
Home Financials are based on the most recent Mortgage that was taken out on this home.
Original Mortgage
$321,712
Interest Rate
6.11%
Mortgage Type
Purchase Money Mortgage
Create a Home Valuation Report for This Property
The Home Valuation Report is an in-depth analysis detailing your home's value as well as a comparison with similar homes in the area
Home Values in the Area
Average Home Value in this Area
Purchase History
| Date | Buyer | Sale Price | Title Company |
|---|---|---|---|
| Stack Neal J | $530,000 | Chicago Title | |
| Thoutt Chad J | $402,141 | Land Title Guarantee Company |
Source: Public Records
Mortgage History
| Date | Status | Borrower | Loan Amount |
|---|---|---|---|
| Open | Stack Neal J | $300,000 | |
| Previous Owner | Thoutt Chad J | $321,712 |
Source: Public Records
Tax History
| Year | Tax Paid | Tax Assessment Tax Assessment Total Assessment is a certain percentage of the fair market value that is determined by local assessors to be the total taxable value of land and additions on the property. | Land | Improvement |
|---|---|---|---|---|
| 2025 | $7,564 | $60,180 | $13,400 | $46,780 |
| 2024 | $7,564 | $60,060 | $12,630 | $47,430 |
| 2023 | $7,505 | $66,120 | $13,900 | $52,220 |
| 2022 | $6,096 | $44,100 | $10,080 | $34,020 |
| 2021 | $6,289 | $45,370 | $10,370 | $35,000 |
| 2020 | $6,176 | $43,970 | $9,650 | $34,320 |
| 2019 | $6,201 | $44,280 | $9,720 | $34,560 |
| 2018 | $5,937 | $40,270 | $7,200 | $33,070 |
| 2017 | $5,555 | $44,520 | $7,960 | $36,560 |
| 2016 | $5,433 | $37,400 | $7,960 | $29,440 |
Source: Public Records
Map
Nearby Homes
- 3172 Traver Dr
- 3100 Blue Sky Cir Unit 14-303
- 3155 Blue Sky Cir Unit 16-303
- 16698 Canby Way
- 3045 Blue Sky Cir Unit 18-102
- 3000 Blue Sky Cir Unit 11-305
- 2985 Blue Sky Cir Unit 7-304
- 2875 Blue Sky Cir Unit 4-208
- 2855 Blue Sky Cir Unit 3-204
- 3333 Chapin Place
- 2800 Blue Sky Cir Unit 2-305
- 2800 Blue Sky Cir Unit 2-203
- 2800 Blue Sky Cir Unit 2-208
- 16566 Edwards Way
- 2745 Blue Sky Cir Unit 1-306
- 2745 Blue Sky Cir Unit 1-107
- 2724 Ironwood Place
- 2764 Ironwood Cir
- 16659 Weston Way
- 16392 Spanish Peak Way
- 16706 Carson Way
- 16719 Cathedral Way
- 16694 Carson Way
- 16707 Cathedral Way
- 16723 Carson Way
- 3279 Traver Dr
- 3317 Traver Dr
- 16711 Carson Way
- 16695 Cathedral Way
- 3261 Traver Dr
- 3335 Traver Dr
- 16699 Carson Way
- 3372 Traver Dr
- 3351 Traver Dr
- 3245 Traver Dr
- 16724 Cathedral Way
- 16683 Cathedral Way
- 16712 Cathedral Way
- 3369 Traver Dr
- 3388 Traver Dr
Your Personal Tour Guide
Ask me questions while you tour the home.