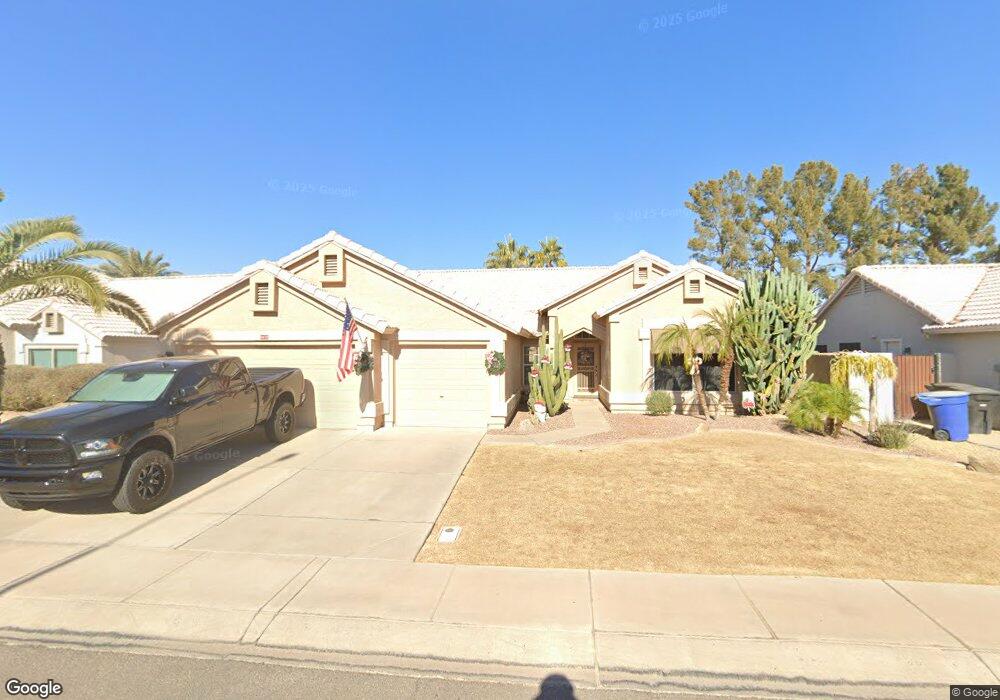
1672 E Erie St Chandler, AZ 85225
East Chandler NeighborhoodEstimated Value: $500,775 - $615,000
4
Beds
2
Baths
2,183
Sq Ft
$256/Sq Ft
Est. Value
About This Home
This home is located at 1672 E Erie St, Chandler, AZ 85225 and is currently estimated at $559,194, approximately $256 per square foot. 1672 E Erie St is a home located in Maricopa County with nearby schools including Sanborn Elementary School, Willis Junior High School, and Chandler High School.
Ownership History
Date
Name
Owned For
Owner Type
Purchase Details
Closed on
Aug 21, 2003
Sold by
Rendek Helen Marie
Bought by
Obrien Brian L and Obrien Stacey A
Current Estimated Value
Home Financials for this Owner
Home Financials are based on the most recent Mortgage that was taken out on this home.
Original Mortgage
$28,500
Outstanding Balance
$12,532
Interest Rate
5.6%
Mortgage Type
New Conventional
Estimated Equity
$546,662
Purchase Details
Closed on
Feb 21, 1996
Sold by
Rendek Robert Bert and Rendek Helen Marie
Bought by
Rendek Robert Bert and Rendek Helen Marie
Purchase Details
Closed on
Aug 2, 1995
Sold by
Testa Erickson Joyce L
Bought by
Rendek Robert B and Rendek Helen M
Purchase Details
Closed on
Nov 2, 1994
Sold by
Erickson Jeffrey Steven
Bought by
Erickson Joyce Testa
Create a Home Valuation Report for This Property
The Home Valuation Report is an in-depth analysis detailing your home's value as well as a comparison with similar homes in the area
Home Values in the Area
Average Home Value in this Area
Purchase History
| Date | Buyer | Sale Price | Title Company |
|---|---|---|---|
| Obrien Brian L | $189,900 | Security Title Agency | |
| Rendek Robert Bert | -- | -- | |
| Rendek Robert B | $134,000 | Old Republic Title Agency | |
| Erickson Joyce Testa | -- | -- |
Source: Public Records
Mortgage History
| Date | Status | Borrower | Loan Amount |
|---|---|---|---|
| Open | Obrien Brian L | $28,500 |
Source: Public Records
Tax History Compared to Growth
Tax History
| Year | Tax Paid | Tax Assessment Tax Assessment Total Assessment is a certain percentage of the fair market value that is determined by local assessors to be the total taxable value of land and additions on the property. | Land | Improvement |
|---|---|---|---|---|
| 2025 | $2,069 | $26,565 | -- | -- |
| 2024 | $1,999 | $25,300 | -- | -- |
| 2023 | $1,999 | $40,910 | $8,180 | $32,730 |
| 2022 | $1,929 | $31,350 | $6,270 | $25,080 |
| 2021 | $2,021 | $29,620 | $5,920 | $23,700 |
| 2020 | $2,012 | $27,780 | $5,550 | $22,230 |
| 2019 | $1,935 | $26,160 | $5,230 | $20,930 |
| 2018 | $1,874 | $24,010 | $4,800 | $19,210 |
| 2017 | $1,747 | $22,470 | $4,490 | $17,980 |
| 2016 | $1,683 | $21,410 | $4,280 | $17,130 |
| 2015 | $1,630 | $21,460 | $4,290 | $17,170 |
Source: Public Records
Map
Nearby Homes
- 420 N Leoma Ln
- 1605 E Chandler Blvd Unit 26
- 155 N Lakeview Blvd Unit 208
- 155 N Lakeview Blvd Unit 108
- 155 N Lakeview Blvd Unit 204
- 110 N Velero St
- 1664 E Buffalo Cir
- 642 N Danyell Ct
- 83 N Amber Ct
- 111 N Soho Place
- 1467 E Boston St
- 1075 E Chandler Blvd Unit 119
- 791 N Velero St
- 245 N Bedford St
- 741 N Soho Place
- 1590 E Robinson Way
- 382 N Ashley Dr
- 195 N Cottonwood St Unit 21
- 1853 E Shannon St
- 1818 S Saddle St
- 1682 E Erie St
- 1652 E Erie St
- 1671 E Tyson Place
- 1661 E Tyson Place
- 1692 E Erie St
- 1642 E Erie St
- 1681 E Tyson Place
- 1651 E Tyson Place
- 1671 E Erie St
- 1661 E Erie St
- 1681 E Erie St Unit 2
- 1691 E Tyson Place
- 1702 E Erie St
- 1632 E Erie St
- 1641 E Tyson Place
- 1691 E Erie St
- 1641 E Erie St
- 1701 E Tyson Place
- 1712 E Erie St
- 1622 E Erie St