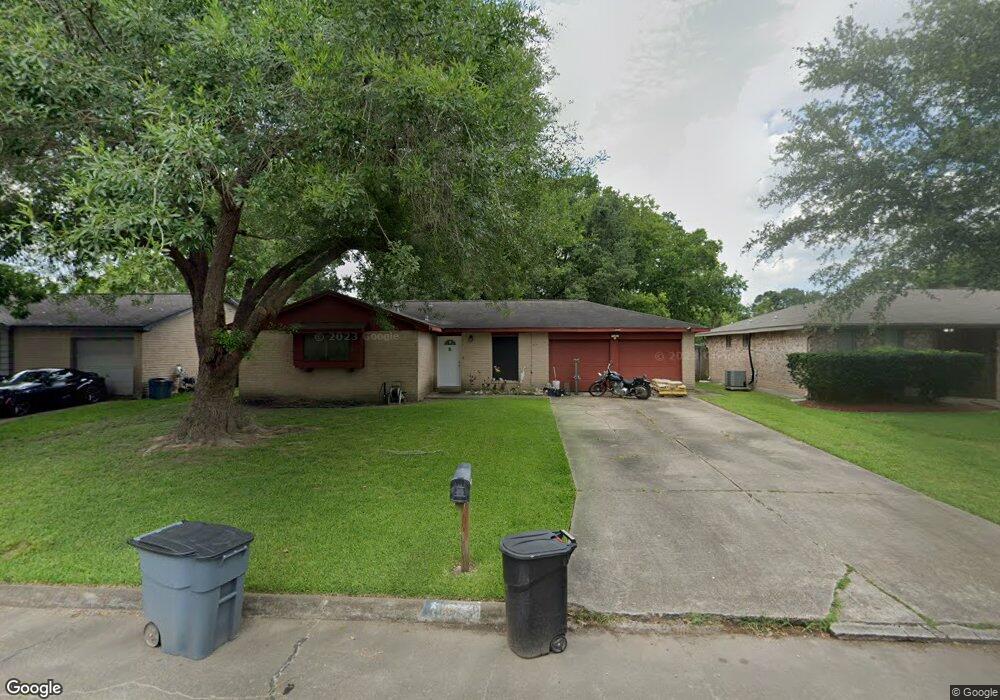
16726 Forest Bend Ave Friendswood, TX 77546
Estimated Value: $217,237 - $237,000
3
Beds
2
Baths
1,125
Sq Ft
$205/Sq Ft
Est. Value
About This Home
This home is located at 16726 Forest Bend Ave, Friendswood, TX 77546 and is currently estimated at $230,309, approximately $204 per square foot. 16726 Forest Bend Ave is a home located in Harris County with nearby schools including Wedgewood Elementary School, Brookside Intermediate School, and Clear Brook High School.
Ownership History
Date
Name
Owned For
Owner Type
Purchase Details
Closed on
Dec 30, 2022
Sold by
Baldwin Beverly
Bought by
Harrigan Shannon K and Harrigan Jeffrey R
Current Estimated Value
Home Financials for this Owner
Home Financials are based on the most recent Mortgage that was taken out on this home.
Original Mortgage
$129,000
Outstanding Balance
$124,996
Interest Rate
6.58%
Mortgage Type
New Conventional
Estimated Equity
$105,313
Purchase Details
Closed on
Aug 1, 2008
Sold by
Pantusa Victor P and Pantusa Kelly L
Bought by
Snyder Johnathon Lee and Snyder Cassandra
Home Financials for this Owner
Home Financials are based on the most recent Mortgage that was taken out on this home.
Original Mortgage
$111,122
Interest Rate
6.47%
Mortgage Type
FHA
Purchase Details
Closed on
Mar 5, 1999
Sold by
Baldwin Heather Michele
Bought by
Baldwin Beverly
Create a Home Valuation Report for This Property
The Home Valuation Report is an in-depth analysis detailing your home's value as well as a comparison with similar homes in the area
Home Values in the Area
Average Home Value in this Area
Purchase History
| Date | Buyer | Sale Price | Title Company |
|---|---|---|---|
| Harrigan Shannon K | -- | Global Title | |
| Snyder Johnathon Lee | -- | First American Title | |
| Baldwin Beverly | -- | -- |
Source: Public Records
Mortgage History
| Date | Status | Borrower | Loan Amount |
|---|---|---|---|
| Open | Harrigan Shannon K | $129,000 | |
| Previous Owner | Snyder Johnathon Lee | $111,122 |
Source: Public Records
Tax History Compared to Growth
Tax History
| Year | Tax Paid | Tax Assessment Tax Assessment Total Assessment is a certain percentage of the fair market value that is determined by local assessors to be the total taxable value of land and additions on the property. | Land | Improvement |
|---|---|---|---|---|
| 2025 | $2,584 | $212,725 | $58,520 | $154,205 |
| 2024 | $2,584 | $195,351 | $58,520 | $136,831 |
| 2023 | $2,584 | $199,509 | $58,520 | $140,989 |
| 2022 | $3,861 | $180,650 | $58,520 | $122,130 |
| 2021 | $3,543 | $157,226 | $49,280 | $107,946 |
| 2020 | $3,442 | $140,596 | $35,421 | $105,175 |
| 2019 | $3,280 | $127,749 | $27,720 | $100,029 |
| 2018 | $758 | $119,293 | $27,720 | $91,573 |
| 2017 | $3,079 | $119,293 | $27,720 | $91,573 |
| 2016 | $2,993 | $115,941 | $27,720 | $88,221 |
| 2015 | $2,440 | $106,720 | $27,720 | $79,000 |
| 2014 | $2,440 | $92,849 | $23,101 | $69,748 |
Source: Public Records
Map
Nearby Homes
- 16703 Hibiscus Ln
- 16607 David Glen Dr
- 16907 Tibet Rd
- 16903 Paint Rock Rd
- 17003 Tibet Rd
- 4015 Ravine Dr
- 17015 Townes Rd
- 16811 Bougainvilla Ln
- 16823 Bougainvilla Ln
- 16510 Blackhawk Blvd
- 16922 Echo Harbor
- 4315 Ravine Dr
- 16406 Blackhawk Blvd
- 3836 Laura Leigh Dr
- 3878 Laura Leigh Dr
- 16423 Hibiscus Ln
- 16327 Blackhawk Blvd
- 4430 Peridot Ln
- 4426 Saffron Ln
- 5498 Apple Blossom Ln
- 16722 Forest Bend Ave
- 16730 Forest Bend Ave
- 16731 David Glen Dr
- 16734 Forest Bend Ave
- 16718 Forest Bend Ave
- 16727 David Glen Dr
- 16735 David Glen Dr
- 16723 David Glen Dr
- 16739 David Glen Dr
- 16727 Forest Bend Ave
- 16714 Forest Bend Ave
- 16731 Forest Bend Ave
- 16723 Forest Bend Ave
- 16719 David Glen Dr
- 16735 Forest Bend Ave
- 16719 Forest Bend Ave
- 16743 David Glen Dr
- 16710 Forest Bend Ave
- 16715 Forest Bend Ave
- 16739 Forest Bend Ave