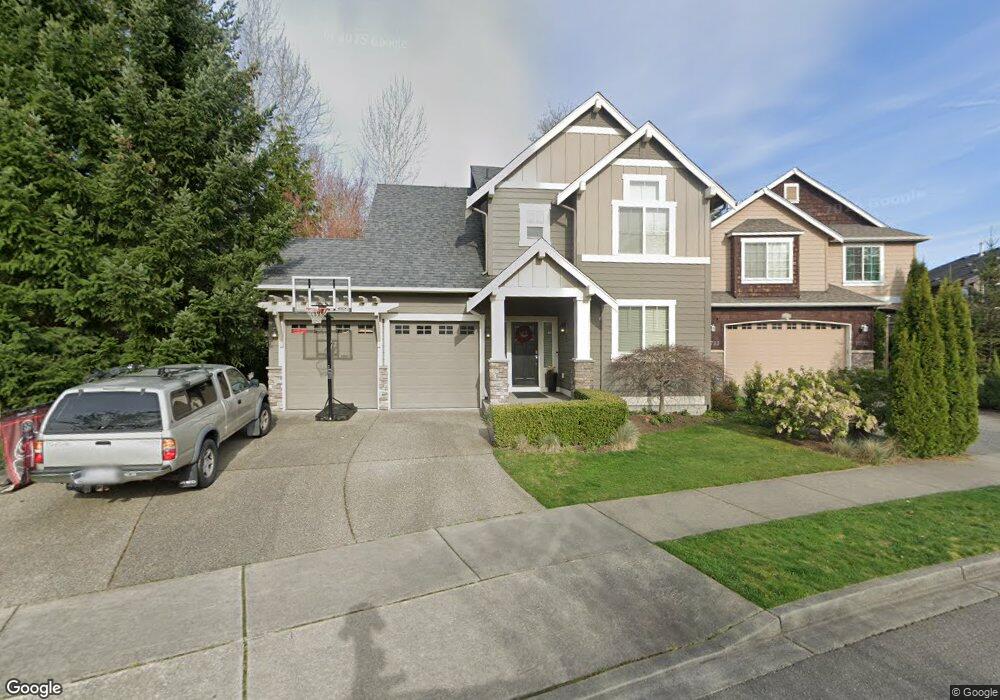
16729 39th Ave SE Bothell, WA 98012
Estimated Value: $966,000 - $1,225,000
3
Beds
3
Baths
1,744
Sq Ft
$621/Sq Ft
Est. Value
About This Home
This home is located at 16729 39th Ave SE, Bothell, WA 98012 and is currently estimated at $1,082,819, approximately $620 per square foot. 16729 39th Ave SE is a home located in Snohomish County with nearby schools including Tambark Creek Elementary School, Gateway Middle School, and Henry M. Jackson High School.
Ownership History
Date
Name
Owned For
Owner Type
Purchase Details
Closed on
Dec 9, 2009
Sold by
Splash Properties Iii Llc
Bought by
Taie Ryan D and Frans Elizabeth M
Current Estimated Value
Home Financials for this Owner
Home Financials are based on the most recent Mortgage that was taken out on this home.
Original Mortgage
$286,356
Outstanding Balance
$183,253
Interest Rate
5.01%
Mortgage Type
New Conventional
Estimated Equity
$899,566
Purchase Details
Closed on
Nov 11, 2009
Sold by
Village Communities Llc
Bought by
Splash Properties Iii Llc
Home Financials for this Owner
Home Financials are based on the most recent Mortgage that was taken out on this home.
Original Mortgage
$286,356
Outstanding Balance
$183,253
Interest Rate
5.01%
Mortgage Type
New Conventional
Estimated Equity
$899,566
Purchase Details
Closed on
Apr 14, 2006
Sold by
The Mcnaughton Group Llc
Bought by
Splash Properties Iii Llc
Create a Home Valuation Report for This Property
The Home Valuation Report is an in-depth analysis detailing your home's value as well as a comparison with similar homes in the area
Home Values in the Area
Average Home Value in this Area
Purchase History
| Date | Buyer | Sale Price | Title Company |
|---|---|---|---|
| Taie Ryan D | $357,945 | Chicago | |
| Splash Properties Iii Llc | -- | None Available | |
| Splash Properties Iii Llc | -- | None Available |
Source: Public Records
Mortgage History
| Date | Status | Borrower | Loan Amount |
|---|---|---|---|
| Open | Taie Ryan D | $286,356 |
Source: Public Records
Tax History
| Year | Tax Paid | Tax Assessment Tax Assessment Total Assessment is a certain percentage of the fair market value that is determined by local assessors to be the total taxable value of land and additions on the property. | Land | Improvement |
|---|---|---|---|---|
| 2026 | $9,148 | $1,082,500 | $753,900 | $328,600 |
| 2025 | $8,777 | $966,900 | $651,000 | $315,900 |
| 2024 | $8,777 | $932,300 | $619,500 | $312,800 |
| 2023 | $8,779 | $1,022,500 | $681,200 | $341,300 |
| 2022 | $6,544 | $658,000 | $368,200 | $289,800 |
| 2020 | $7,265 | $614,600 | $335,000 | $279,600 |
| 2019 | $6,771 | $574,900 | $295,000 | $279,900 |
| 2018 | $6,401 | $494,800 | $245,000 | $249,800 |
| 2017 | $5,681 | $442,900 | $192,000 | $250,900 |
| 2016 | $5,207 | $418,400 | $178,000 | $240,400 |
| 2015 | $4,999 | $380,600 | $162,000 | $218,600 |
| 2013 | $4,618 | $311,200 | $122,000 | $189,200 |
Source: Public Records
Map
Nearby Homes
- 4003 168th Place SE
- 16519 37th Dr SE
- 3701 170th Place SE
- 16606 35th Ave SE Unit 9A
- 17116 35th Dr SE Unit C6
- 17116 35th Dr SE Unit C2
- 17116 35th Dr SE Unit A2
- 17715 2nd Ave W
- 17321 40th Ave SE
- 16116 35th Park SE
- 3620 159th Place SE
- 17001 31st Dr SE
- 3918 177th St SE
- 3414 176th Place SE
- 4117 177th Place SE
- 3621 156th Place SE
- 3933 178th Place SE
- 17817 41st Dr SE
- 5008 169th St SE
- 17913 38th Dr SE Unit 20
- 16733 39th Ave SE
- 16730 39th Ave SE
- 3907 168th Place SE
- 16806 39th Ave SE
- 3820 167th Place SE
- 3901 168th Place SE
- 3905 168th Place SE
- 3913 168th Place SE
- 3913 168th St SE
- 16812 39th Ave SE
- 3814 167th Place SE
- 3825 168th Place SE
- 3815 167th Place SE
- 3819 168th Place SE
- 3917 168th Place SE
- 16628 38th Ave SE
- 3808 167th Place SE
- 3923 168th Place SE
- 3809 167th Place SE
- 3813 168th Place SE
Your Personal Tour Guide
Ask me questions while you tour the home.