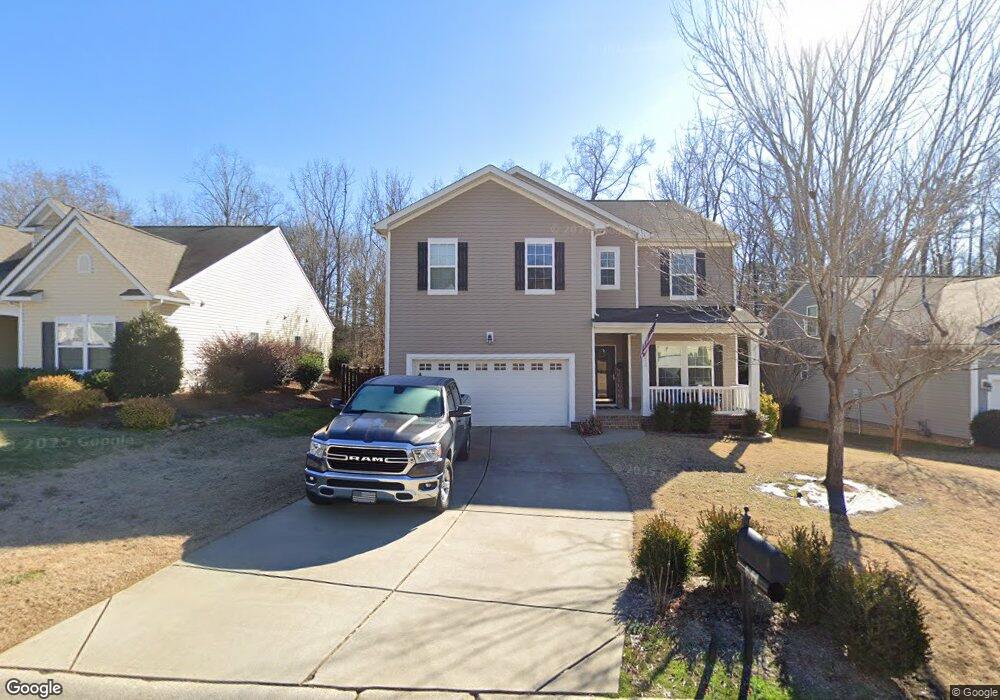
1673 Beleek Ridge Ln Unit 269 Clover, SC 29710
Estimated Value: $489,065 - $541,000
4
Beds
3
Baths
2,616
Sq Ft
$194/Sq Ft
Est. Value
About This Home
This home is located at 1673 Beleek Ridge Ln Unit 269, Clover, SC 29710 and is currently estimated at $508,016, approximately $194 per square foot. 1673 Beleek Ridge Ln Unit 269 is a home located in York County with nearby schools including Oakridge Elementary School, Oakridge Middle School, and Clover High School.
Ownership History
Date
Name
Owned For
Owner Type
Purchase Details
Closed on
Feb 27, 2017
Sold by
Mayfield Justin and Mayfield Tara L
Bought by
Venosta Daniel and Venosta Andrea
Current Estimated Value
Home Financials for this Owner
Home Financials are based on the most recent Mortgage that was taken out on this home.
Original Mortgage
$254,425
Outstanding Balance
$209,490
Interest Rate
4.09%
Mortgage Type
FHA
Estimated Equity
$298,526
Purchase Details
Closed on
Mar 7, 2014
Sold by
The Ryland Group Inc
Bought by
Mayfield Justin and Mayfield Tara L
Home Financials for this Owner
Home Financials are based on the most recent Mortgage that was taken out on this home.
Original Mortgage
$229,990
Interest Rate
4.19%
Mortgage Type
VA
Purchase Details
Closed on
May 26, 2011
Sold by
Fc Mill Creek Llc
Bought by
Timberstone Homes Inc
Purchase Details
Closed on
Mar 5, 2009
Sold by
Westport Homes Of North Carolina Inc
Bought by
Fc Mill Creek Llc
Create a Home Valuation Report for This Property
The Home Valuation Report is an in-depth analysis detailing your home's value as well as a comparison with similar homes in the area
Home Values in the Area
Average Home Value in this Area
Purchase History
| Date | Buyer | Sale Price | Title Company |
|---|---|---|---|
| Venosta Daniel | $260,000 | None Available | |
| Mayfield Justin | $229,990 | -- | |
| Timberstone Homes Inc | $1,600,000 | -- | |
| Fc Mill Creek Llc | $2,470,000 | -- |
Source: Public Records
Mortgage History
| Date | Status | Borrower | Loan Amount |
|---|---|---|---|
| Open | Venosta Daniel | $254,425 | |
| Previous Owner | Mayfield Justin | $229,990 |
Source: Public Records
Tax History Compared to Growth
Tax History
| Year | Tax Paid | Tax Assessment Tax Assessment Total Assessment is a certain percentage of the fair market value that is determined by local assessors to be the total taxable value of land and additions on the property. | Land | Improvement |
|---|---|---|---|---|
| 2025 | $1,729 | $12,631 | $1,802 | $10,829 |
| 2024 | $1,552 | $10,983 | $2,200 | $8,783 |
| 2023 | $1,591 | $10,983 | $2,200 | $8,783 |
| 2022 | $1,311 | $10,983 | $2,200 | $8,783 |
| 2021 | -- | $10,983 | $2,200 | $8,783 |
| 2020 | $1,243 | $10,983 | $0 | $0 |
| 2019 | $1,237 | $10,020 | $0 | $0 |
| 2018 | $5,274 | $15,030 | $0 | $0 |
| 2017 | -- | $15,030 | $0 | $0 |
| 2016 | -- | $0 | $0 | $0 |
| 2014 | $27 | $0 | $0 | $0 |
| 2013 | $27 | $3,600 | $3,600 | $0 |
Source: Public Records
Map
Nearby Homes
- 1828 Kilkenny Dr
- 2139 Eskridge Terrace
- 450 Battery Cir
- 444 Battery Cir
- 431 Battery Cir
- 370 Battery Cir Unit 20
- 438 Elizabeth Valley Ln
- 4211 Maggie Springs Way
- 2213 Iron Works Dr
- 3432 Bruce Ridge
- 304 Inland Cove Ct
- 319 Inland Cove Ct
- 0000 Oakridge Rd
- 2678 Landing Pointe Dr
- 5000 Mill Creek Rd
- 00 Hwy
- 1727 Mineral Springs Rd
- 113 Sycamore Ln
- 1921 Notchwood Ct
- 335 Carroll Cove
- 1673 Beleek Ridge Ln
- 1677 Beleek Ridge Ln
- 1681 Beleek Ridge Ln
- 1665 Beleek Ridge Ln
- 1672 Beleek Ridge Ln
- 1668 Beleek Ridge Ln
- 1676 Beleek Ridge Ln
- 1661 Beleek Ridge Ln
- 1685 Beleek Ridge Ln
- 1664 Beleek Ridge Ln
- 1684 Beleek Ridge Ln
- 1657 Beleek Ridge Ln
- 1660 Beleek Ridge Ln Unit 282
- 1689 Beleek Ridge Ln
- 1688 Beleek Ridge Ln
- 1656 Beleek Ridge Ln
- 1653 Beleek Ridge Ln
- 1692 Beleek Ridge Ln Unit 274
- 1652 Beleek Ridge Ln
- 1649 Beleek Ridge Ln