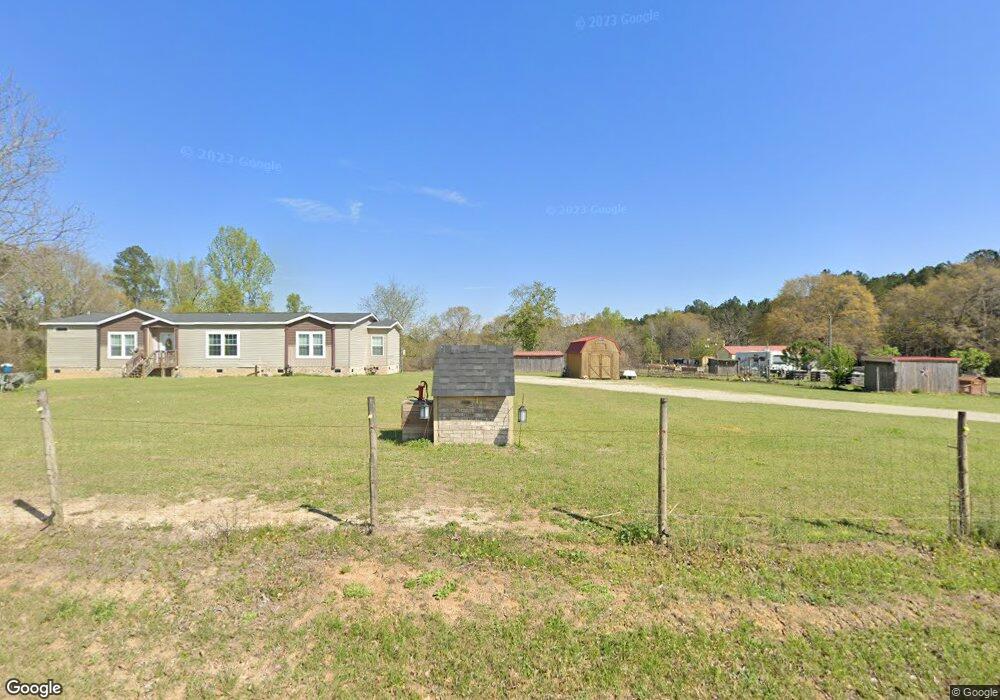
1673 Firetower Rd Stapleton, GA 30823
Estimated Value: $271,369 - $350,000
5
Beds
3
Baths
2,589
Sq Ft
$119/Sq Ft
Est. Value
About This Home
This home is located at 1673 Firetower Rd, Stapleton, GA 30823 and is currently estimated at $307,342, approximately $118 per square foot. 1673 Firetower Rd is a home located in Jefferson County with nearby schools including Jefferson County High School.
Ownership History
Date
Name
Owned For
Owner Type
Purchase Details
Closed on
Nov 3, 2020
Sold by
Eldridge Kirby E
Bought by
Eldridge Bronson J and Eldridge Laura G
Current Estimated Value
Purchase Details
Closed on
Apr 23, 2012
Sold by
Bodenheimer Garnold F
Bought by
Eldridge Kirby E and Eldridge Carol A
Purchase Details
Closed on
Jul 31, 2008
Sold by
Chance David F
Bought by
Bodenheimer Garnold F and Bodenheimer Merita
Purchase Details
Closed on
Dec 1, 2005
Sold by
Holmes Bessie M
Bought by
Chance David F and Chance Shaline P
Home Financials for this Owner
Home Financials are based on the most recent Mortgage that was taken out on this home.
Original Mortgage
$113,000
Interest Rate
6.23%
Mortgage Type
New Conventional
Create a Home Valuation Report for This Property
The Home Valuation Report is an in-depth analysis detailing your home's value as well as a comparison with similar homes in the area
Purchase History
| Date | Buyer | Sale Price | Title Company |
|---|---|---|---|
| Eldridge Bronson J | -- | -- | |
| Eldridge Kirby E | $180,000 | -- | |
| Bodenheimer Garnold F | $152,500 | -- | |
| Chance David F | $128,000 | -- |
Source: Public Records
Mortgage History
| Date | Status | Borrower | Loan Amount |
|---|---|---|---|
| Previous Owner | Chance David F | $113,000 |
Source: Public Records
Tax History
| Year | Tax Paid | Tax Assessment Tax Assessment Total Assessment is a certain percentage of the fair market value that is determined by local assessors to be the total taxable value of land and additions on the property. | Land | Improvement |
|---|---|---|---|---|
| 2025 | $1,445 | $65,976 | $21,217 | $44,759 |
| 2024 | $1,450 | $60,594 | $18,449 | $42,145 |
| 2023 | $1,551 | $68,061 | $27,350 | $40,711 |
| 2022 | $1,244 | $60,660 | $26,012 | $34,648 |
| 2021 | $1,353 | $57,218 | $21,875 | $35,343 |
| 2020 | $1,367 | $57,645 | $21,875 | $35,770 |
| 2019 | $1,414 | $58,473 | $21,875 | $36,598 |
| 2018 | $1,389 | $57,283 | $20,782 | $36,501 |
| 2017 | $1,439 | $57,699 | $19,688 | $38,011 |
| 2016 | $1,342 | $58,584 | $20,782 | $37,802 |
| 2015 | -- | $60,291 | $21,875 | $38,416 |
| 2014 | -- | $62,114 | $21,875 | $40,238 |
| 2013 | -- | $43,204 | $1,218 | $41,985 |
Source: Public Records
Map
Nearby Homes
- 3191 Gene Howard Rd
- 1300 Terry Dr
- 169 E Sheppard St
- 1234 Stapleton Acres Rd
- 651 Harvey St
- 6975 Georgia 80
- Lot 32 Stapleton Acres Dr
- 207 Old Thomson Rd
- 0 Old Thomson Rd
- 10199 Ga Highway 296
- 1167 Shaunee Ln
- 1289 Brittany St
- 407 Russell St
- 1280 Old Lucky Bridge Rd
- 0 Hwy 80 and Old Stapleton Rd Unit 10622530
- 203 S Wrens Cir
- 102 Ellis St
- 109 Matthews St
- 80 Georgia 80
- 0 Howard St Unit 548508
- 1795 Firetower Rd
- 2697 Gene Howard Rd
- 0 Gene Howard Rd Unit 443303
- 2171 Gene Howard Rd
- 2795 Gene Howard Rd
- 2861 Gene Howard Rd
- 2711 Highway 80
- 2931 Gene Howard Rd
- 2677 Highway 80
- 3526 Highway 102
- 3008 Gene Howard Rd
- 2253 Ga Highway 80 W
- 3522 Highway 102
- 1165 Dixon Ln
- 1141 Dixon Ln
- 1931 Gene Howard Rd
- 0 88 Hwy Unit 20034247
- 1278 Kilgore Rd
- 4646 Ga Highway 102
- 3230 Gene Howard Rd
Your Personal Tour Guide
Ask me questions while you tour the home.