1673 Hunter Rd Elberton, GA 30635
Estimated Value: $245,000 - $287,000
2
Beds
2
Baths
1,170
Sq Ft
$223/Sq Ft
Est. Value
About This Home
This home is located at 1673 Hunter Rd, Elberton, GA 30635 and is currently estimated at $260,507, approximately $222 per square foot. 1673 Hunter Rd is a home located in Elbert County with nearby schools including Elbert County Primary School, Elbert County Elementary School, and Elbert County Middle School.
Ownership History
Date
Name
Owned For
Owner Type
Purchase Details
Closed on
Jan 1, 1972
Current Estimated Value
Create a Home Valuation Report for This Property
The Home Valuation Report is an in-depth analysis detailing your home's value as well as a comparison with similar homes in the area
Home Values in the Area
Average Home Value in this Area
Purchase History
| Date | Buyer | Sale Price | Title Company |
|---|---|---|---|
| -- | -- | -- |
Source: Public Records
Tax History Compared to Growth
Tax History
| Year | Tax Paid | Tax Assessment Tax Assessment Total Assessment is a certain percentage of the fair market value that is determined by local assessors to be the total taxable value of land and additions on the property. | Land | Improvement |
|---|---|---|---|---|
| 2024 | $1,026 | $79,405 | $39,409 | $39,996 |
| 2023 | $590 | $79,405 | $39,409 | $39,996 |
| 2022 | $675 | $51,678 | $23,458 | $28,220 |
| 2021 | $620 | $51,678 | $23,458 | $28,220 |
| 2020 | $499 | $39,942 | $18,766 | $21,176 |
| 2019 | $514 | $39,942 | $18,766 | $21,176 |
| 2018 | $524 | $39,942 | $18,766 | $21,176 |
| 2017 | $465 | $36,945 | $18,766 | $18,179 |
| 2016 | $381 | $35,289 | $18,766 | $16,523 |
| 2015 | -- | $35,289 | $18,766 | $16,523 |
| 2014 | -- | $35,289 | $18,766 | $16,523 |
Source: Public Records
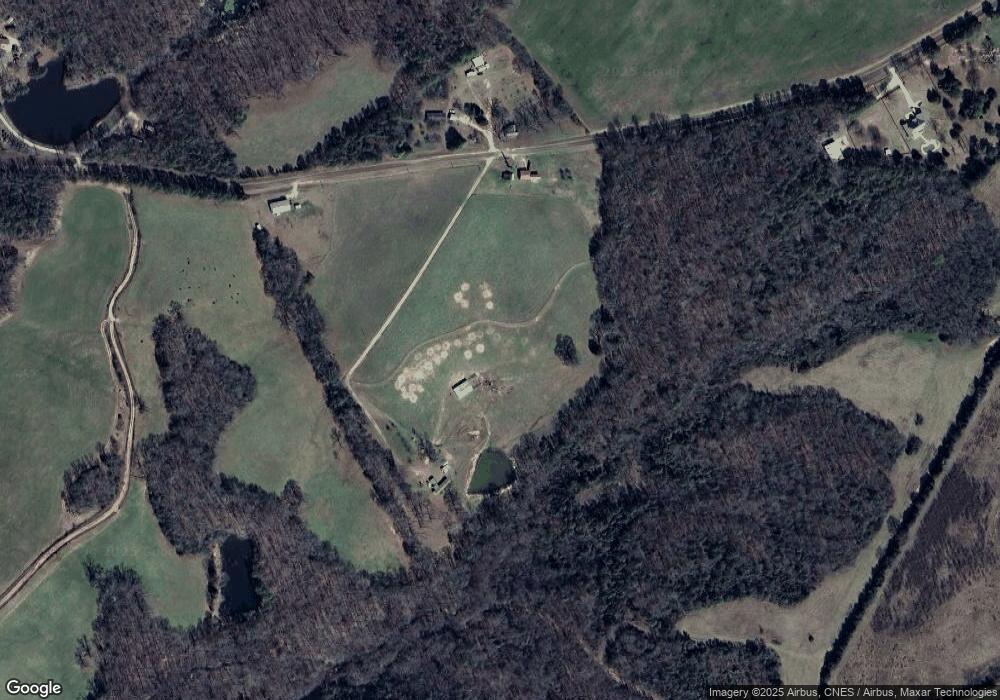
Map
Nearby Homes
- 2946 Rock Branch Rd
- 3113 Press Mann Rd
- 0 Moore Rd Unit 10552577
- 0 Anderson Hwy Unit 24629664
- 0 Anderson Hwy Unit 10536298
- 0 Jacks Hat Rd Unit 10614621
- 0 Jacks Hat Rd Unit 24288811
- 0 Jacks Hat Rd Unit 10597905
- 0 Jacks Hat Rd Unit 7657227
- 0 Hornets Bridge Rd Unit 10523059
- 0 Hornets Bridge Rd Unit 10523061
- 0 Hornets Bridge Rd Unit 10601215
- 0 Hornets Bridge Rd Unit 2 10295928
- 1049 Jaybird Rd
- 0 Gregg Shoals Dr Unit 10497348
- 0 Gregg Shoals Dr Unit CL342115
- 0 Gregg Shoals Dr Unit LotWP001 24031325
- 00 Hornets Bridge Rd
- 2187 Turner Hill Rd
- 0 Millstone Creek Rd Unit 10531895
- 1672 Hunter Rd
- 1643 Hunter Rd
- 1727 Hunter Rd
- 3181 Rock Branch Rd
- 3199 Rock Branch Rd
- 0000 Hunter Rd
- 0 Hunter Rd Unit 8578741
- 0 Hunter Rd Unit 8122955
- 0 Hunter Rd Unit 7507465
- 0 Hunter Rd Unit 7508505
- 0 Hunter Rd Unit 8915384
- 0 Hunter Rd Unit 9011835
- 1614 Hunter Rd
- 3129 Rock Branch Rd
- 3154 Rock Branch Rd
- 1599 Hunter Rd
- 3099 Rock Branch Rd
- 3217 Rock Branch Rd
- 3221 Rock Branch Rd
- 3178 Rock Branch Rd