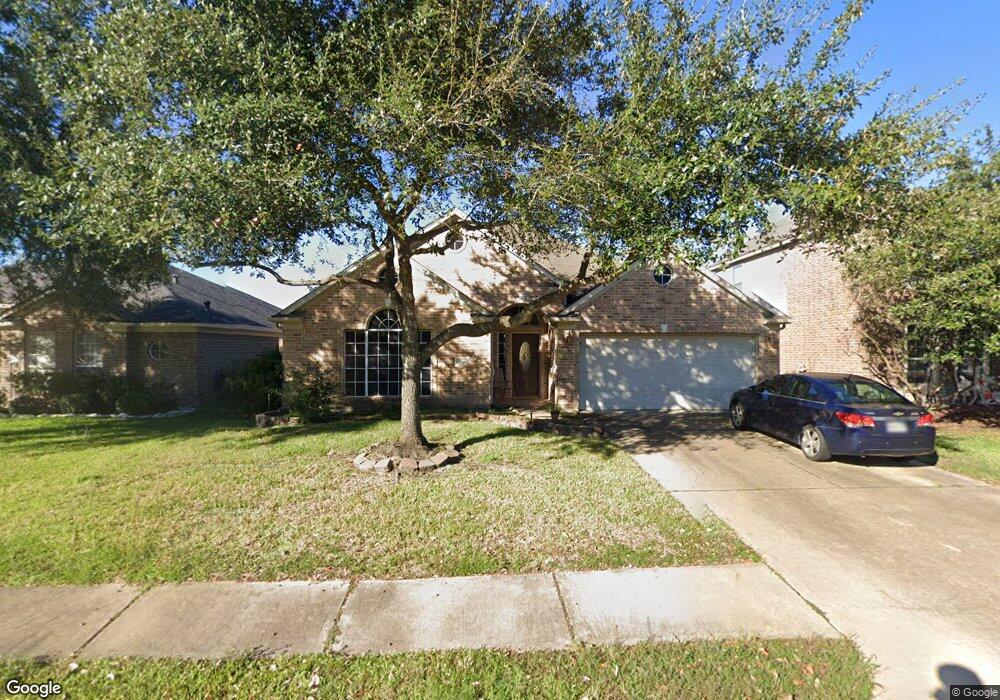
16738 Spring Barker Dr Cypress, TX 77429
Estimated Value: $316,475 - $353,000
4
Beds
2
Baths
2,300
Sq Ft
$146/Sq Ft
Est. Value
About This Home
This home is located at 16738 Spring Barker Dr, Cypress, TX 77429 and is currently estimated at $334,869, approximately $145 per square foot. 16738 Spring Barker Dr is a home located in Harris County with nearby schools including Farney Elementary School, Goodson Middle, and Cypress Woods High School.
Ownership History
Date
Name
Owned For
Owner Type
Purchase Details
Closed on
Jan 5, 2006
Sold by
Heath Fred G
Bought by
Clemonds Matthew and Clemonds Ronda
Current Estimated Value
Home Financials for this Owner
Home Financials are based on the most recent Mortgage that was taken out on this home.
Original Mortgage
$145,800
Outstanding Balance
$81,756
Interest Rate
6.23%
Mortgage Type
VA
Estimated Equity
$253,113
Purchase Details
Closed on
Dec 16, 2004
Sold by
Seiter Victor C
Bought by
Heath Fred G
Home Financials for this Owner
Home Financials are based on the most recent Mortgage that was taken out on this home.
Original Mortgage
$128,960
Interest Rate
5.78%
Mortgage Type
Stand Alone First
Purchase Details
Closed on
Jan 10, 2003
Sold by
Long Lake Ltd
Bought by
Seiter Victor C
Home Financials for this Owner
Home Financials are based on the most recent Mortgage that was taken out on this home.
Original Mortgage
$116,826
Interest Rate
6.16%
Create a Home Valuation Report for This Property
The Home Valuation Report is an in-depth analysis detailing your home's value as well as a comparison with similar homes in the area
Home Values in the Area
Average Home Value in this Area
Purchase History
| Date | Buyer | Sale Price | Title Company |
|---|---|---|---|
| Clemonds Matthew | -- | Charter Title Company | |
| Heath Fred G | -- | Fidelity National Title | |
| Seiter Victor C | -- | American Title Co |
Source: Public Records
Mortgage History
| Date | Status | Borrower | Loan Amount |
|---|---|---|---|
| Open | Clemonds Matthew | $145,800 | |
| Previous Owner | Heath Fred G | $128,960 | |
| Previous Owner | Seiter Victor C | $116,826 | |
| Closed | Heath Fred G | $32,240 |
Source: Public Records
Tax History Compared to Growth
Tax History
| Year | Tax Paid | Tax Assessment Tax Assessment Total Assessment is a certain percentage of the fair market value that is determined by local assessors to be the total taxable value of land and additions on the property. | Land | Improvement |
|---|---|---|---|---|
| 2025 | $5,385 | $288,787 | $64,033 | $224,754 |
| 2024 | $5,385 | $311,158 | $64,033 | $247,125 |
| 2023 | $5,385 | $316,452 | $64,033 | $252,419 |
| 2022 | $6,721 | $289,720 | $53,361 | $236,359 |
| 2021 | $6,395 | $232,476 | $51,744 | $180,732 |
| 2020 | $6,188 | $219,869 | $51,744 | $168,125 |
| 2019 | $6,139 | $211,993 | $23,716 | $188,277 |
| 2018 | $1,945 | $200,083 | $23,716 | $176,367 |
| 2017 | $5,866 | $200,083 | $23,716 | $176,367 |
| 2016 | $5,332 | $190,270 | $23,716 | $166,554 |
| 2015 | $3,781 | $180,179 | $23,716 | $156,463 |
| 2014 | $3,781 | $157,284 | $19,712 | $137,572 |
Source: Public Records
Map
Nearby Homes
- 16730 Spring Barker Dr
- 16703 Summer Cypress Ct
- 14434 Glade Point Dr
- 14339 Pelican Marsh Dr
- 14331 Pelican Marsh Dr
- 14311 Glade Point Dr
- 14710 Timber Cliff Ln
- 14206 Barker Bayou Ct
- 14631 Timber Cliff Ln
- 14623 Valley Stone Ct
- 16218 Barklea Rd
- 16318 Cypress Point Dr
- 16323 Jast Dr
- 16551 Cypress Bridge Dr
- 16306 Cypress Trace Dr
- 16302 Cypress Point Dr
- 14806 Cypress Timber Dr
- 14706 Emerald Cypress Ln
- 16503 Timberidge Ct
- 16530 Boston Post Rd
- 16742 Spring Barker Dr
- 16734 Spring Barker Dr
- 16746 Spring Barker Dr
- 16726 Spring Barker Dr
- 16739 Spring Barker Dr
- 16743 Spring Barker Dr
- 16735 Spring Barker Dr
- 14339 Plum Springs Dr
- 16731 Spring Barker Dr
- 14335 Plum Springs Dr
- 16722 Spring Barker Dr
- 14331 Plum Springs Dr
- 16711 Thorn Cypress Dr
- 16727 Spring Barker Dr
- 16715 Thorn Cypress Dr
- 16707 Thorn Cypress Dr
- 16719 Thorn Cypress Dr
- 16718 Spring Barker Dr
- 16742 Spring Glade Dr
- 16746 Spring Glade Dr