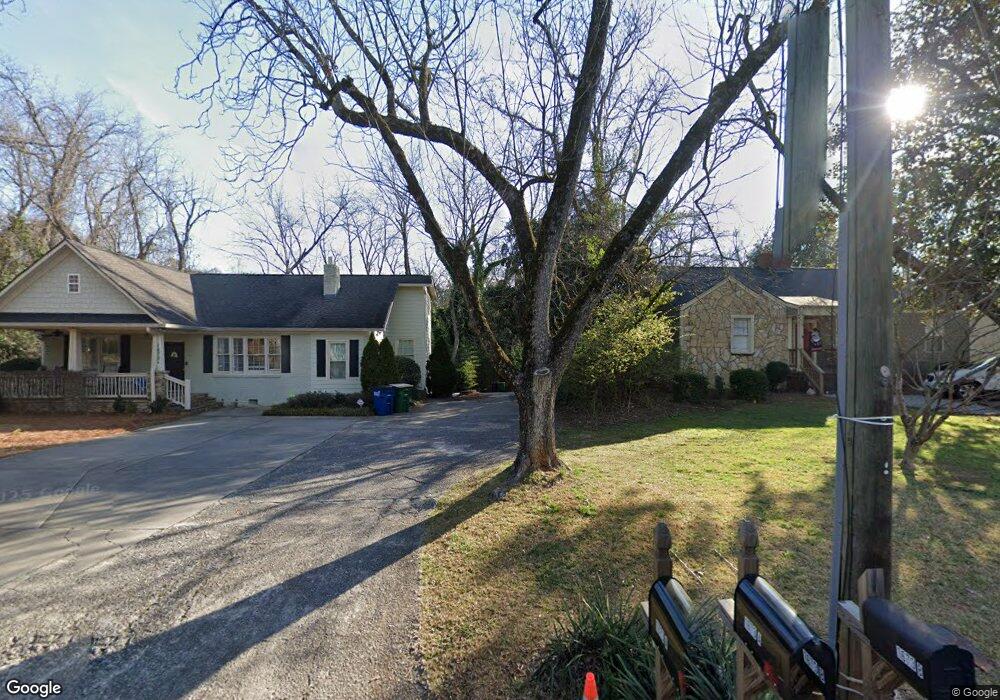
1673B S Milledge Ave Athens, GA 30605
Five Points NeighborhoodEstimated Value: $398,764 - $518,000
3
Beds
3
Baths
1,056
Sq Ft
$445/Sq Ft
Est. Value
About This Home
This home is located at 1673B S Milledge Ave, Athens, GA 30605 and is currently estimated at $469,941, approximately $445 per square foot. 1673B S Milledge Ave is a home located in Clarke County with nearby schools including Barrow Elementary School, Clarke Middle School, and Clarke Central High School.
Ownership History
Date
Name
Owned For
Owner Type
Purchase Details
Closed on
Jun 19, 2025
Sold by
Zehna Frank Joseph
Bought by
Zehna Frank Joseph Sr Tr and Zehna Stephanie Brown Tr
Current Estimated Value
Purchase Details
Closed on
Dec 8, 2015
Sold by
Clover Street Properties L
Bought by
Zehna Frank Joseph and Zehna Stephanie B
Home Financials for this Owner
Home Financials are based on the most recent Mortgage that was taken out on this home.
Original Mortgage
$112,500
Interest Rate
4.01%
Mortgage Type
New Conventional
Purchase Details
Closed on
Dec 31, 2014
Sold by
Gad Properties Llc
Bought by
Clover Street Properties Llc
Purchase Details
Closed on
Feb 2, 2009
Sold by
Gad Hesham M
Bought by
Gad Properties Llc
Purchase Details
Closed on
Jan 8, 2007
Sold by
Not Provided
Bought by
Gad Properties Llc
Purchase Details
Closed on
Mar 16, 2004
Sold by
Grpc Properties Llc & Hannah G
Bought by
Reeves Gregory P and Hannah Gregory
Purchase Details
Closed on
Dec 16, 2003
Sold by
Glass Perry and Reeves Hannah G Gregory P
Bought by
Grpc Properties Llc & Hannah Gregory
Create a Home Valuation Report for This Property
The Home Valuation Report is an in-depth analysis detailing your home's value as well as a comparison with similar homes in the area
Home Values in the Area
Average Home Value in this Area
Purchase History
| Date | Buyer | Sale Price | Title Company |
|---|---|---|---|
| Zehna Frank Joseph Sr Tr | -- | -- | |
| Zehna Frank Joseph Sr Tr | -- | -- | |
| Zehna Frank Joseph | -- | -- | |
| Clover Street Properties Llc | $140,000 | -- | |
| Gad Properties Llc | -- | -- | |
| Gad Properties Llc | $180,000 | -- | |
| Gad Properties Llc | -- | -- | |
| Reeves Gregory P | $67,500 | -- | |
| Grpc Properties Llc & Hannah Gregory | $40,000 | -- |
Source: Public Records
Mortgage History
| Date | Status | Borrower | Loan Amount |
|---|---|---|---|
| Previous Owner | Zehna Frank Joseph | $112,500 |
Source: Public Records
Tax History Compared to Growth
Tax History
| Year | Tax Paid | Tax Assessment Tax Assessment Total Assessment is a certain percentage of the fair market value that is determined by local assessors to be the total taxable value of land and additions on the property. | Land | Improvement |
|---|---|---|---|---|
| 2025 | $4,516 | $145,432 | $42,000 | $103,432 |
| 2024 | $4,516 | $133,668 | $42,000 | $91,668 |
| 2023 | $4,177 | $114,759 | $35,700 | $79,059 |
| 2022 | $3,141 | $98,474 | $26,180 | $72,294 |
| 2021 | $2,710 | $80,419 | $26,180 | $54,239 |
| 2020 | $2,585 | $76,704 | $23,800 | $52,904 |
| 2019 | $2,474 | $72,865 | $23,800 | $49,065 |
| 2018 | $2,394 | $70,529 | $23,800 | $46,729 |
| 2017 | $2,026 | $59,681 | $23,800 | $35,881 |
| 2016 | $2,072 | $61,016 | $23,800 | $37,216 |
| 2015 | $1,904 | $58,636 | $21,420 | $37,216 |
| 2014 | $2,025 | $59,463 | $21,420 | $38,043 |
Source: Public Records
Map
Nearby Homes
- 1697 S Milledge Ave
- 685 Pinecrest Dr
- 183 Parkway Dr
- 115 Annes Ct
- 760 E Campus Rd Unit 93
- 760 E Campus Rd Unit 95
- 655 E Campus Rd Unit 12
- 204 Gran Ellen Dr
- 265 Annes Ct
- 490 Ofarrell St
- 160 Riverdale Dr
- 128 Habersham Dr
- 221 University Dr
- 515 Hampton Ct
- 2019 S Lumpkin St
- 275 Westview Dr
- 275 Davis Estates Rd
- 253 Sleepy Creek Dr
- 1673 S Milledge Ave
- 1673 S Milledge Ave
- 1673 S Milledge Ave Unit 1673-B
- 1673 S Milledge Ave Unit B
- 1673 S Milledge Ave
- 1663 S Milledge Ave
- 1682 S Milledge Ave
- 1672 B South Milledge Ave
- 1672 S Milledge Ave
- 1679 S Milledge Ave
- 1684 S Milledge Ave
- 1684 S Milledge Ave
- 2 Milledge Ct
- 1686 S Milledge Ave
- 1673-B S Milledge Ave
- 1662 S Milledge Ave
- 20 Milledge Ct
- 1683 S Milledge Ave
- 0 S Milledge Ave Unit 1892432-2927995
- 0 S Milledge Ave Unit 1892432-2927911