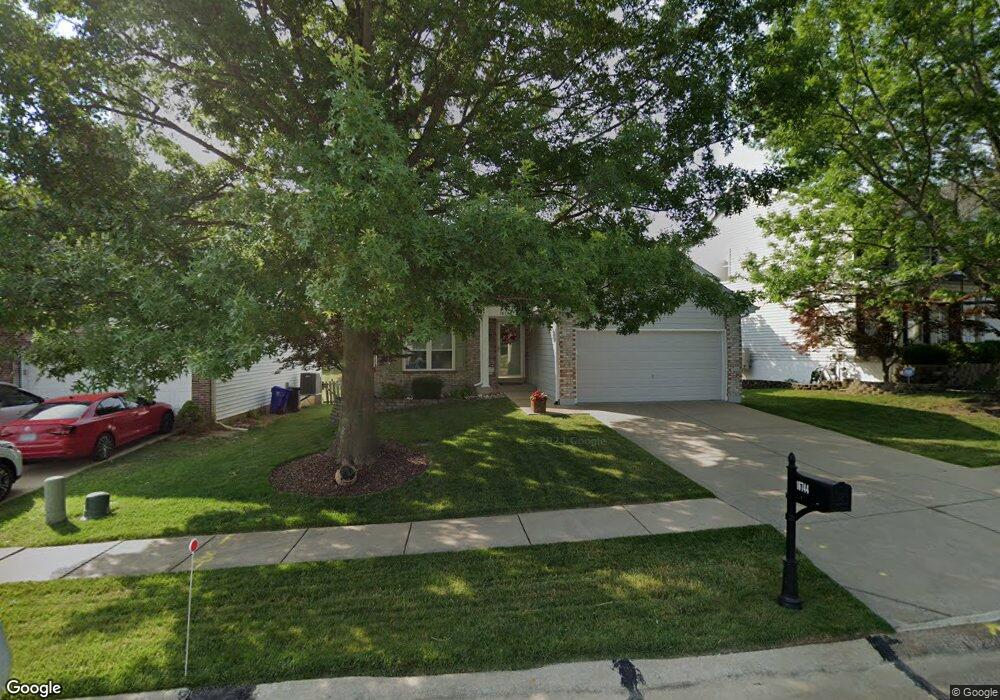
16744 Hickory Crest Dr Ballwin, MO 63011
Estimated Value: $332,050 - $391,000
3
Beds
2
Baths
1,168
Sq Ft
$304/Sq Ft
Est. Value
About This Home
This home is located at 16744 Hickory Crest Dr, Ballwin, MO 63011 and is currently estimated at $354,513, approximately $303 per square foot. 16744 Hickory Crest Dr is a home located in St. Louis County with nearby schools including Green Pines Elementary School, Wildwood Middle School, and Lafayette High School.
Ownership History
Date
Name
Owned For
Owner Type
Purchase Details
Closed on
May 31, 2017
Sold by
Bolton Janice M
Bought by
Bolton Janice M and Janice M Bolton Trust
Current Estimated Value
Purchase Details
Closed on
Apr 30, 2002
Sold by
Mocker David G and Mocker Kimberly A
Bought by
Bolton Janice M
Home Financials for this Owner
Home Financials are based on the most recent Mortgage that was taken out on this home.
Original Mortgage
$100,000
Outstanding Balance
$42,577
Interest Rate
7.19%
Estimated Equity
$311,936
Purchase Details
Closed on
Sep 12, 2000
Sold by
Mocker David G and Mocker Kimberly A
Bought by
Mocker David G and Mocker Kimberly A
Purchase Details
Closed on
Mar 21, 1997
Sold by
Jones Company Custom Homes Co The
Bought by
Mocker David G and Mocker Kimberly A
Home Financials for this Owner
Home Financials are based on the most recent Mortgage that was taken out on this home.
Original Mortgage
$120,650
Interest Rate
7.65%
Create a Home Valuation Report for This Property
The Home Valuation Report is an in-depth analysis detailing your home's value as well as a comparison with similar homes in the area
Home Values in the Area
Average Home Value in this Area
Purchase History
| Date | Buyer | Sale Price | Title Company |
|---|---|---|---|
| Bolton Janice M | -- | None Available | |
| Bolton Janice M | $169,000 | -- | |
| Mocker David G | -- | -- | |
| Mocker David G | -- | -- |
Source: Public Records
Mortgage History
| Date | Status | Borrower | Loan Amount |
|---|---|---|---|
| Open | Bolton Janice M | $100,000 | |
| Previous Owner | Mocker David G | $120,650 |
Source: Public Records
Tax History
| Year | Tax Paid | Tax Assessment Tax Assessment Total Assessment is a certain percentage of the fair market value that is determined by local assessors to be the total taxable value of land and additions on the property. | Land | Improvement |
|---|---|---|---|---|
| 2025 | $3,763 | $56,400 | $26,280 | $30,120 |
| 2024 | $3,763 | $54,110 | $14,590 | $39,520 |
| 2023 | $3,760 | $54,110 | $14,590 | $39,520 |
| 2022 | $3,201 | $42,790 | $14,590 | $28,200 |
| 2021 | $3,177 | $42,790 | $14,590 | $28,200 |
| 2020 | $3,244 | $41,650 | $13,130 | $28,520 |
| 2019 | $3,257 | $41,650 | $13,130 | $28,520 |
| 2018 | $3,069 | $37,010 | $10,940 | $26,070 |
| 2017 | $2,996 | $37,010 | $10,940 | $26,070 |
| 2016 | $2,931 | $34,830 | $9,500 | $25,330 |
Source: Public Records
Map
Nearby Homes
- 32 Hickory Valley Ct
- 2329 Hunters Crest Dr
- 2407 Sandalwood Creek Ct Unit A
- 16900 Red Dragon Place
- 2319 Sandalwood Creek Ct
- 2319 Paradise Peak Cir
- 2437 August Grove Ct
- 2479 August Grove Ct
- 16858 Babler View Dr
- 16555 Birch Forest Dr
- 2408 Larksong Dr N
- 17054 Cambury Ln
- 2424 Eatherton Rd
- 17125 Windsor Crest Blvd
- 16520 Forest Pine Dr
- 2536 Fossett Dr
- 2472 Grover Ridge Dr
- 17145 Centaur Station Dr
- 2140 Dartmouth Gate Ct
- 16421 Hollister Crossing Dr
- 16748 Hickory Crest Dr
- 16740 Hickory Crest Dr
- 16736 Hickory Crest Dr
- 16752 Hickory Crest Dr
- 16731 Hickory Meadows Ct
- 16725 Hickory Meadows Ct
- 16737 Hickory Meadows Ct
- 16743 Hickory Meadows Ct
- 16756 Hickory Crest Dr
- 16732 Hickory Crest Dr
- 16739 Hickory Crest Dr
- 16747 Hickory Crest Dr
- 16719 Hickory Meadows Ct
- 16735 Hickory Crest Dr
- 16713 Hickory Meadows Ct
- 16755 Hickory Crest Dr
- 16728 Hickory Crest Dr
- 16731 Hickory Crest Dr
- 16760 Hickory Crest Dr
- 16749 Hickory Meadows Ct
Your Personal Tour Guide
Ask me questions while you tour the home.