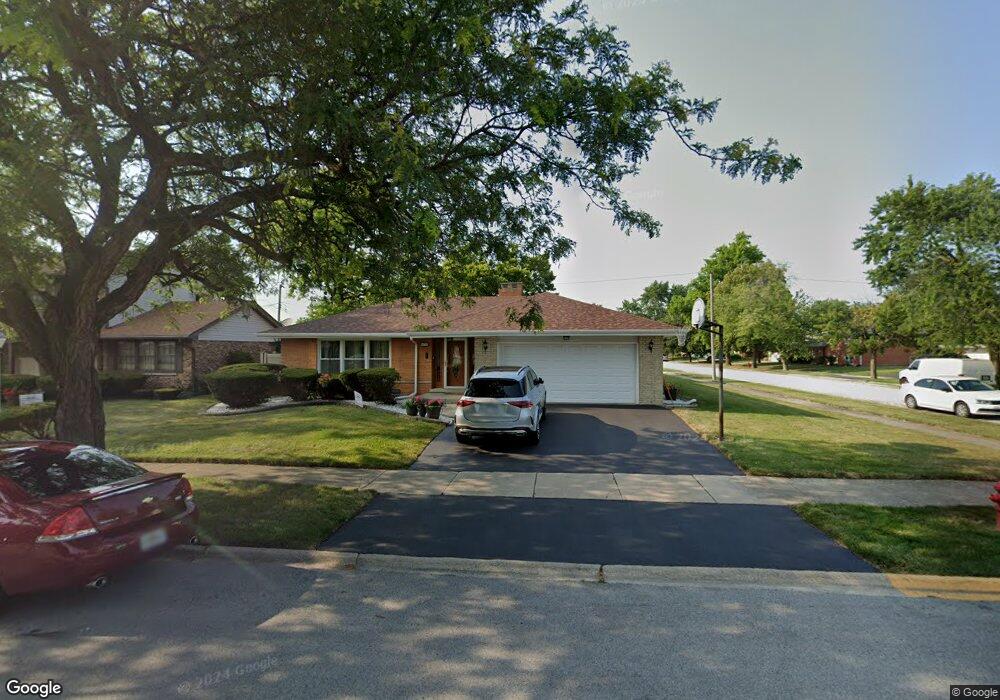
16746 Claire Ln South Holland, IL 60473
Central District NeighborhoodEstimated Value: $239,000 - $301,000
4
Beds
3
Baths
1,843
Sq Ft
$142/Sq Ft
Est. Value
About This Home
This home is located at 16746 Claire Ln, South Holland, IL 60473 and is currently estimated at $260,851, approximately $141 per square foot. 16746 Claire Ln is a home located in Cook County with nearby schools including Greenwood Elementary School, Mckinley Elementary School, and Mckinley Jr High School.
Ownership History
Date
Name
Owned For
Owner Type
Purchase Details
Closed on
Oct 12, 2012
Sold by
Mack Michael D and Mack Natalie P
Bought by
Truts Mack Michael D and Michael D Mack Truts
Current Estimated Value
Purchase Details
Closed on
Jun 26, 2001
Sold by
Wise David and Wise Diane
Bought by
Mack Michael D
Home Financials for this Owner
Home Financials are based on the most recent Mortgage that was taken out on this home.
Original Mortgage
$146,850
Outstanding Balance
$57,127
Interest Rate
7.27%
Mortgage Type
VA
Estimated Equity
$203,724
Purchase Details
Closed on
May 10, 2001
Sold by
South Holland Trust & Svgs Bank
Bought by
Wise David and Wise Diane
Home Financials for this Owner
Home Financials are based on the most recent Mortgage that was taken out on this home.
Original Mortgage
$146,850
Outstanding Balance
$57,127
Interest Rate
7.27%
Mortgage Type
VA
Estimated Equity
$203,724
Purchase Details
Closed on
Dec 22, 2000
Sold by
Suburban Bank & Trust Company
Bought by
South Holland Trust & Svgs Bank and Trust #00-7445
Create a Home Valuation Report for This Property
The Home Valuation Report is an in-depth analysis detailing your home's value as well as a comparison with similar homes in the area
Home Values in the Area
Average Home Value in this Area
Purchase History
| Date | Buyer | Sale Price | Title Company |
|---|---|---|---|
| Truts Mack Michael D | -- | None Available | |
| Mack Michael D | $144,000 | -- | |
| Wise David | $135,000 | -- | |
| South Holland Trust & Svgs Bank | -- | -- |
Source: Public Records
Mortgage History
| Date | Status | Borrower | Loan Amount |
|---|---|---|---|
| Open | Mack Michael D | $146,850 | |
| Previous Owner | Wise David | $108,000 |
Source: Public Records
Tax History Compared to Growth
Tax History
| Year | Tax Paid | Tax Assessment Tax Assessment Total Assessment is a certain percentage of the fair market value that is determined by local assessors to be the total taxable value of land and additions on the property. | Land | Improvement |
|---|---|---|---|---|
| 2024 | -- | $20,000 | $4,305 | $15,695 |
| 2023 | -- | $20,000 | $4,305 | $15,695 |
| 2022 | $0 | $12,516 | $3,718 | $8,798 |
| 2021 | $5,031 | $12,515 | $3,718 | $8,797 |
| 2020 | $5,031 | $12,515 | $3,718 | $8,797 |
| 2019 | $5,368 | $13,262 | $3,131 | $10,131 |
| 2018 | $5,122 | $13,262 | $3,131 | $10,131 |
| 2017 | $5,038 | $13,262 | $3,131 | $10,131 |
| 2016 | $4,739 | $12,043 | $2,935 | $9,108 |
| 2015 | $4,526 | $12,043 | $2,935 | $9,108 |
| 2014 | $4,439 | $12,043 | $2,935 | $9,108 |
| 2013 | $4,810 | $13,753 | $2,935 | $10,818 |
Source: Public Records
Map
Nearby Homes
- 554 E 168th Place
- 452 E 167th St
- 529 E 166th Place
- 16850 School St
- 16914 Parkside Ave
- 16816 S Park Ave
- 520 E 166th St
- 503 Marie Dr
- 16550 Elm Ct
- 16811 Louis Ct
- 16535 Elm Ct
- 16927 Langley Ave
- 16626 Holland Ave
- 16961 Parkside Ave
- 16631 Langley Ave
- 16948 S Park Ave
- 16506 School St
- 429 E 164th Place
- 16645 Cottage Grove Ave
- 16808 Wausau Ave
- 510 E 168th St
- 16738 Claire Ln
- 16745 Claire Ln
- 16730 Claire Ln
- 16745 Maple St
- 16737 Maple St
- 517 E 168th St
- 16737 Claire Ln
- 523 E 168th St
- 16729 Maple St
- 16724 Claire Ln
- 16729 Claire Ln
- 529 E 168th St
- 16806 Maple St
- 532 E 168th St
- 16723 Maple St
- 533 E 168th St
- 533 E 168th St
- 463 E 168th St
- 16723 Claire Ln