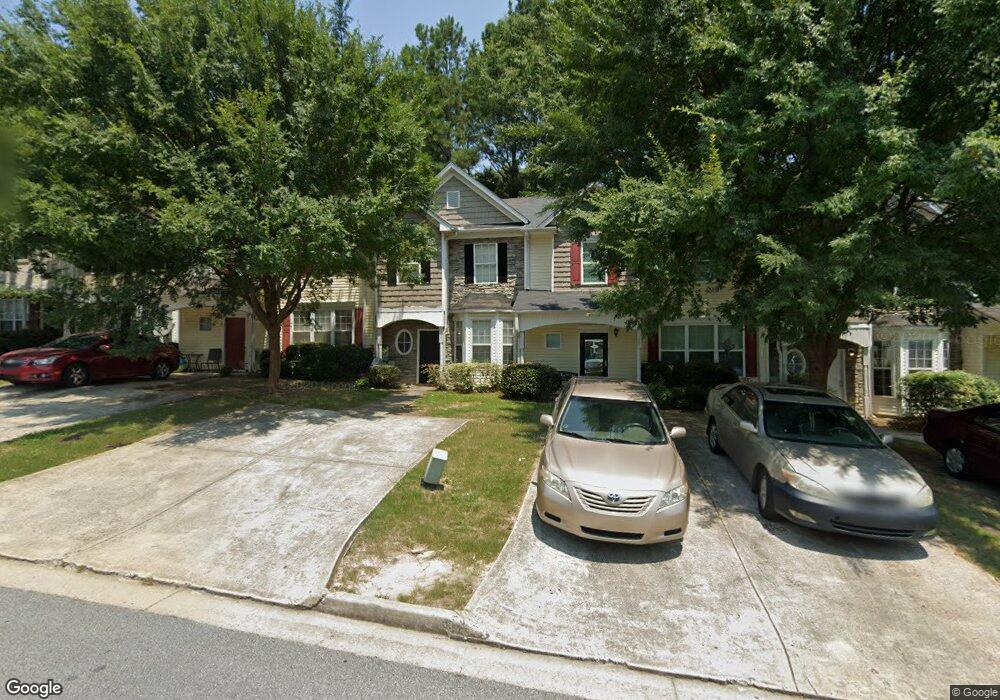
1675 Camden Forrest Way Riverdale, GA 30296
Estimated Value: $191,000 - $212,000
3
Beds
2
Baths
1,302
Sq Ft
$153/Sq Ft
Est. Value
About This Home
This home is located at 1675 Camden Forrest Way, Riverdale, GA 30296 and is currently estimated at $199,317, approximately $153 per square foot. 1675 Camden Forrest Way is a home located in Clayton County with nearby schools including Oliver Elementary School, North Clayton Middle School, and North Clayton High School.
Ownership History
Date
Name
Owned For
Owner Type
Purchase Details
Closed on
Apr 6, 2021
Sold by
Theophan Madeleine
Bought by
Comfort Property Grp Llc
Current Estimated Value
Purchase Details
Closed on
Oct 15, 2010
Sold by
Theophan Madeleine
Bought by
Theophan Madeleine and Theophan Lionel
Purchase Details
Closed on
Jun 17, 2010
Sold by
Sanon Charly
Bought by
Theophane Madeleine
Purchase Details
Closed on
Apr 21, 2006
Sold by
Long Pegggy V
Bought by
Sanon Charly
Home Financials for this Owner
Home Financials are based on the most recent Mortgage that was taken out on this home.
Original Mortgage
$86,000
Interest Rate
6.31%
Mortgage Type
New Conventional
Purchase Details
Closed on
Apr 30, 2002
Sold by
Forrest Homes Inc
Bought by
Long Peggy V
Home Financials for this Owner
Home Financials are based on the most recent Mortgage that was taken out on this home.
Original Mortgage
$106,250
Interest Rate
6.98%
Mortgage Type
FHA
Create a Home Valuation Report for This Property
The Home Valuation Report is an in-depth analysis detailing your home's value as well as a comparison with similar homes in the area
Home Values in the Area
Average Home Value in this Area
Purchase History
| Date | Buyer | Sale Price | Title Company |
|---|---|---|---|
| Comfort Property Grp Llc | -- | -- | |
| Theophan Madeleine | -- | -- | |
| Theophane Madeleine | $35,000 | -- | |
| Sanon Charly | $107,500 | -- | |
| Long Peggy V | $107,200 | -- |
Source: Public Records
Mortgage History
| Date | Status | Borrower | Loan Amount |
|---|---|---|---|
| Previous Owner | Sanon Charly | $86,000 | |
| Previous Owner | Long Peggy V | $106,250 |
Source: Public Records
Tax History Compared to Growth
Tax History
| Year | Tax Paid | Tax Assessment Tax Assessment Total Assessment is a certain percentage of the fair market value that is determined by local assessors to be the total taxable value of land and additions on the property. | Land | Improvement |
|---|---|---|---|---|
| 2024 | $2,872 | $72,640 | $5,600 | $67,040 |
| 2023 | $2,586 | $70,560 | $5,600 | $64,960 |
| 2022 | $2,109 | $52,760 | $5,600 | $47,160 |
| 2021 | $1,757 | $43,520 | $5,600 | $37,920 |
| 2020 | $1,536 | $37,458 | $5,600 | $31,858 |
| 2019 | $1,241 | $29,632 | $4,800 | $24,832 |
| 2018 | $1,113 | $26,470 | $4,800 | $21,670 |
| 2017 | $903 | $21,266 | $4,800 | $16,466 |
| 2016 | $986 | $23,290 | $4,800 | $18,490 |
| 2015 | $881 | $0 | $0 | $0 |
| 2014 | $862 | $20,720 | $5,600 | $15,120 |
Source: Public Records
Map
Nearby Homes
- 6076 Camden Forrest Dr
- 6073 Camden Forrest Dr
- 1695 Camden Forrest Trail
- 6099 Camden Forrest Dr
- 6080 Camden Forrest Cove
- 6105 Camden Forrest Ct
- 1791 Flat Shoals Rd
- 6105 E Fayetteville Dr
- 1711 Austin Dr
- 5967 Yellowood Ct
- 6181 E Fayetteville Dr
- 5937 Yellowood Ct
- 0 Cater Ln Unit 10461792
- 0 Cater Ln Unit 7526768
- 6207 Willowbrook Dr
- 1593 Willow Wood Trace
- 1618 Blossom Dr
- 6253 E Fayetteville Dr
- 1836 Whitworth Dr
- 1677 Camden Forrest Way Unit 111
- 1677 Camden Forrest Way
- 1673 Camden Forrest Way
- 1679 Camden Forrest Way
- 1671 Camden Forrest Way
- 1681 Camden Forrest Way
- 1669 Camden Forrest Way
- 0 Camden Forrest Way Unit 3191671
- 0 Camden Forrest Way Unit 8615687
- 0 Camden Forrest Way Unit 7141067
- 0 Camden Forrest Way Unit 8496281
- 1685 Camden Forrest Way
- 1667 Camden Forrest Way Unit 111
- 1687 Camden Forrest Way
- 1689 Camden Forrest Way
- 6087 Camden Forrest Cove
- 1678 Camden Forrest Way
- 1676 Camden Forrest Way
- 1676 Camden Forrest Way Unit 1676
- 1680 Camden Forrest Way