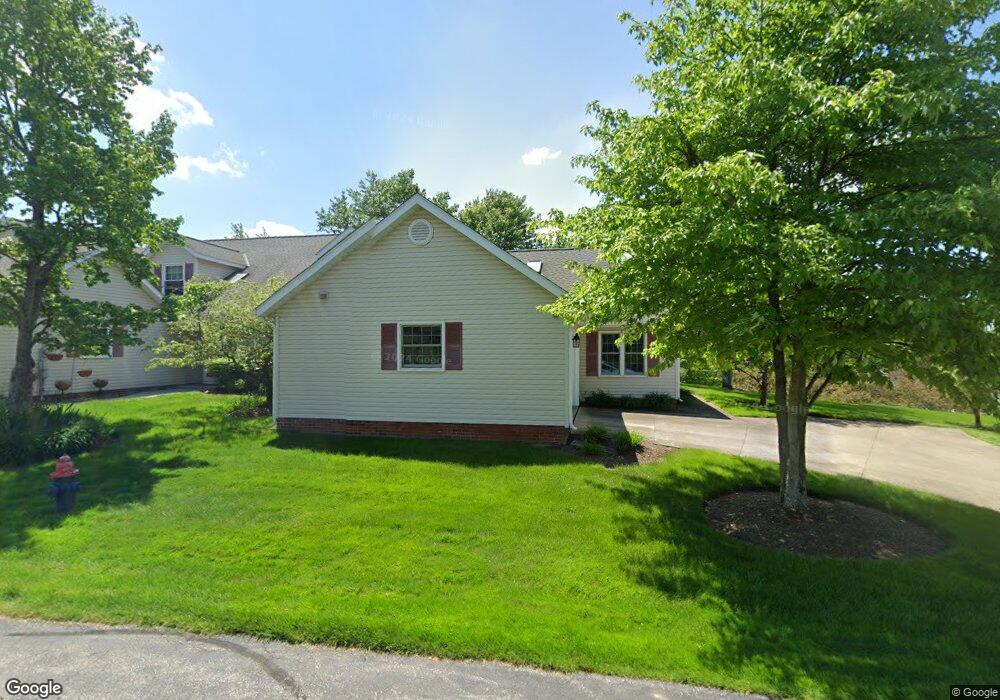
1675 Chapman Way Unit 1421 Broadview Heights, OH 44147
Estimated Value: $298,000 - $371,000
3
Beds
2
Baths
1,815
Sq Ft
$181/Sq Ft
Est. Value
About This Home
This home is located at 1675 Chapman Way Unit 1421, Broadview Heights, OH 44147 and is currently estimated at $328,106, approximately $180 per square foot. 1675 Chapman Way Unit 1421 is a home located in Cuyahoga County with nearby schools including Assumption Academy and South Suburban Montessori School.
Ownership History
Date
Name
Owned For
Owner Type
Purchase Details
Closed on
Jul 29, 2009
Sold by
Farris Joan Marie
Bought by
Griffith Carrie A
Current Estimated Value
Home Financials for this Owner
Home Financials are based on the most recent Mortgage that was taken out on this home.
Original Mortgage
$115,000
Interest Rate
5.43%
Mortgage Type
Unknown
Purchase Details
Closed on
May 14, 2007
Sold by
Garhart Edward G
Bought by
Farris Joan Marie
Home Financials for this Owner
Home Financials are based on the most recent Mortgage that was taken out on this home.
Original Mortgage
$91,500
Interest Rate
6.2%
Mortgage Type
Unknown
Purchase Details
Closed on
Apr 15, 1992
Sold by
Walters Robert L and D A
Bought by
Garhart Edward G
Purchase Details
Closed on
Jan 1, 1991
Bought by
Walters Robert L and D A
Create a Home Valuation Report for This Property
The Home Valuation Report is an in-depth analysis detailing your home's value as well as a comparison with similar homes in the area
Home Values in the Area
Average Home Value in this Area
Purchase History
| Date | Buyer | Sale Price | Title Company |
|---|---|---|---|
| Griffith Carrie A | $165,000 | Newman Title | |
| Farris Joan Marie | $171,500 | Erie Title Agency | |
| Garhart Edward G | $126,000 | -- | |
| Walters Robert L | -- | -- |
Source: Public Records
Mortgage History
| Date | Status | Borrower | Loan Amount |
|---|---|---|---|
| Previous Owner | Griffith Carrie A | $115,000 | |
| Previous Owner | Farris Joan Marie | $91,500 |
Source: Public Records
Tax History
| Year | Tax Paid | Tax Assessment Tax Assessment Total Assessment is a certain percentage of the fair market value that is determined by local assessors to be the total taxable value of land and additions on the property. | Land | Improvement |
|---|---|---|---|---|
| 2025 | $5,343 | $91,910 | $9,205 | $82,705 |
| 2024 | $5,659 | $91,910 | $9,205 | $82,705 |
| 2023 | $4,693 | $70,700 | $7,070 | $63,630 |
| 2022 | $4,663 | $70,700 | $7,070 | $63,630 |
| 2021 | $4,734 | $70,700 | $7,070 | $63,630 |
| 2020 | $4,126 | $58,910 | $5,880 | $53,030 |
| 2019 | $4,010 | $168,300 | $16,800 | $151,500 |
| 2018 | $4,051 | $58,910 | $5,880 | $53,030 |
| 2017 | $3,959 | $55,830 | $5,880 | $49,950 |
| 2016 | $3,769 | $55,830 | $5,880 | $49,950 |
| 2015 | $3,611 | $55,830 | $5,880 | $49,950 |
| 2014 | $3,611 | $54,220 | $5,710 | $48,510 |
Source: Public Records
Map
Nearby Homes
- 1660 Chapman Way
- 1605 Chapman Way Unit 14
- 1360 Old Mill Path
- 2025 Foxglove Ln Unit 1703
- 1740 Tanhollow Trail
- 1205 Mallard Pond Cir
- 0 W Boston Rd
- 2081 McClaren Ln
- 10305 Broadview Rd
- 10315 Broadview Rd
- 2839 Gates Ct
- 421 Bordeaux Blvd
- 355 Calistoga Ct
- 456 Bordeaux Blvd
- 452 Bordeaux Blvd
- 433 Bordeaux Blvd
- 1045 Orchard Ln
- 0 Broadview Rd Unit 5192368
- 9990 Broadview Rd
- 4274 Brookhaven Dr
- 1695 Chapman Way Unit 1423
- 1685 Chapman Way
- 1650 Chapman Way
- 1650 Chapman Way Unit 14-5
- 1655 Chapman Way Unit 1419
- 1665 Chapman Way Unit 1420
- 1670 Chapman Way Unit 143
- 1690 Chapman Way
- 1680 Chapman Way
- 1690 Windrow Ln Unit 1220
- 1725 Windrow Ln
- 1725 Windrow Ln Unit 1219
- 1640 Windrow Ln Unit 1222
- 1670 Windrow Ln Unit 1221
- 1640 Chapman Way Unit 146
- 1630 Chapman Way Unit 147
- 1790 Cortland Ln Unit 151
- 1780 Cortland Ln Unit 1502
- 1780 Cortland Ln Unit 15-2
- 1635 Chapman Way Unit 1417
Your Personal Tour Guide
Ask me questions while you tour the home.