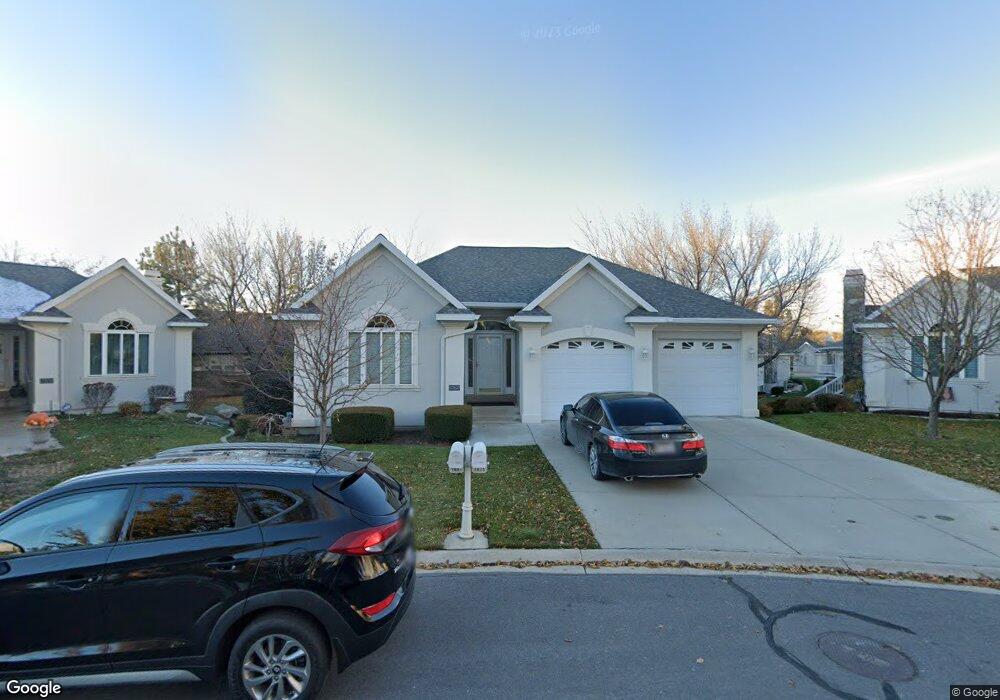
1675 Linden Ln Bountiful, UT 84010
Estimated Value: $595,000 - $822,000
3
Beds
4
Baths
1,783
Sq Ft
$401/Sq Ft
Est. Value
About This Home
This home is located at 1675 Linden Ln, Bountiful, UT 84010 and is currently estimated at $714,110, approximately $400 per square foot. 1675 Linden Ln is a home located in Davis County with nearby schools including J A Taylor Elementary School, Centerville Jr High, and Viewmont High School.
Ownership History
Date
Name
Owned For
Owner Type
Purchase Details
Closed on
May 1, 2025
Sold by
Mcarthur Robert
Bought by
Nielson James R and Nielson Annmarie
Current Estimated Value
Purchase Details
Closed on
Jan 25, 2023
Sold by
Cushing Family Trust
Bought by
Mcarthur Robert
Home Financials for this Owner
Home Financials are based on the most recent Mortgage that was taken out on this home.
Original Mortgage
$325,000
Interest Rate
6.31%
Mortgage Type
New Conventional
Purchase Details
Closed on
Jan 26, 2001
Sold by
Cushing Anita D and Cushing Anita
Bought by
Cushing Anita D and The Byron Franklin Davenport & Anita Kay
Purchase Details
Closed on
Dec 19, 2000
Sold by
Cushing John R
Bought by
Cushing John R and The Cushing Family Trust
Purchase Details
Closed on
Oct 3, 2000
Sold by
Mjm I Ltd Liability Company
Bought by
Cushing John R and Cushing Anita
Create a Home Valuation Report for This Property
The Home Valuation Report is an in-depth analysis detailing your home's value as well as a comparison with similar homes in the area
Purchase History
| Date | Buyer | Sale Price | Title Company |
|---|---|---|---|
| Nielson James R | -- | None Listed On Document | |
| Nielson James R | -- | None Listed On Document | |
| Mcarthur Robert | -- | Alpine Legal Title | |
| Cushing Anita D | -- | -- | |
| Cushing John R | -- | -- | |
| Cushing John R | -- | Western States Title Company |
Source: Public Records
Mortgage History
| Date | Status | Borrower | Loan Amount |
|---|---|---|---|
| Previous Owner | Mcarthur Robert | $325,000 |
Source: Public Records
Tax History
| Year | Tax Paid | Tax Assessment Tax Assessment Total Assessment is a certain percentage of the fair market value that is determined by local assessors to be the total taxable value of land and additions on the property. | Land | Improvement |
|---|---|---|---|---|
| 2025 | $4,428 | $429,000 | $86,350 | $342,650 |
| 2024 | $4,164 | $410,300 | $62,150 | $348,150 |
| 2023 | $4,447 | $795,000 | $113,000 | $682,000 |
| 2022 | $3,989 | $389,950 | $57,200 | $332,750 |
| 2021 | $3,284 | $490,000 | $86,000 | $404,000 |
| 2020 | $3,294 | $497,000 | $55,600 | $441,400 |
| 2019 | $3,007 | $442,000 | $52,000 | $390,000 |
| 2018 | $2,656 | $399,000 | $54,000 | $345,000 |
| 2016 | $2,370 | $193,050 | $36,300 | $156,750 |
| 2015 | $2,375 | $182,930 | $36,300 | $146,630 |
| 2014 | $2,296 | $180,936 | $18,333 | $162,603 |
| 2013 | -- | $161,931 | $20,075 | $141,856 |
Source: Public Records
Map
Nearby Homes
- 204 Lyman Ln
- 951 Centerville Commons Way
- 96 Village Square Rd
- 328 W Pages Ln
- 1625 Pages Place
- 16 W 780 S
- 235 W 1400 N
- 462 Pitford Dr
- 1260 N 200 W
- 967 S Courtyard Ln
- 1420 N Main St
- 150 E 735 S Unit 23
- 330 W Paradiso Ln
- 1520 N 550 W
- 324 S 600 W
- 1130 N 200 W
- 214 E 1250 N
- 366 W 1000 N
- 345 E 600 S
- 88 W 50 S Unit C-3
- 1705 Linden Ln
- 1657 Linden Ln
- 1707 Linden Ln
- 1655 Linden Ln
- 171 Country Springs Dr
- 175 Country Springs Dr
- 1713 Country Springs Ln
- 1713 Country Springs Ln Unit 132
- 1696 N 200 W
- 1656 Linden Ln
- 1708 N 200 W
- 1721 Country Springs Ln
- 1686 Aliwood Way
- 1680 Aliwood Way
- 1637 Linden Ln
- 179 Country Springs Dr
- 1674 Aliwood Way
- 1674 Aliwood Way Unit 3
- 1640 Linden Ln
- 1668 Aliwood Way
Your Personal Tour Guide
Ask me questions while you tour the home.