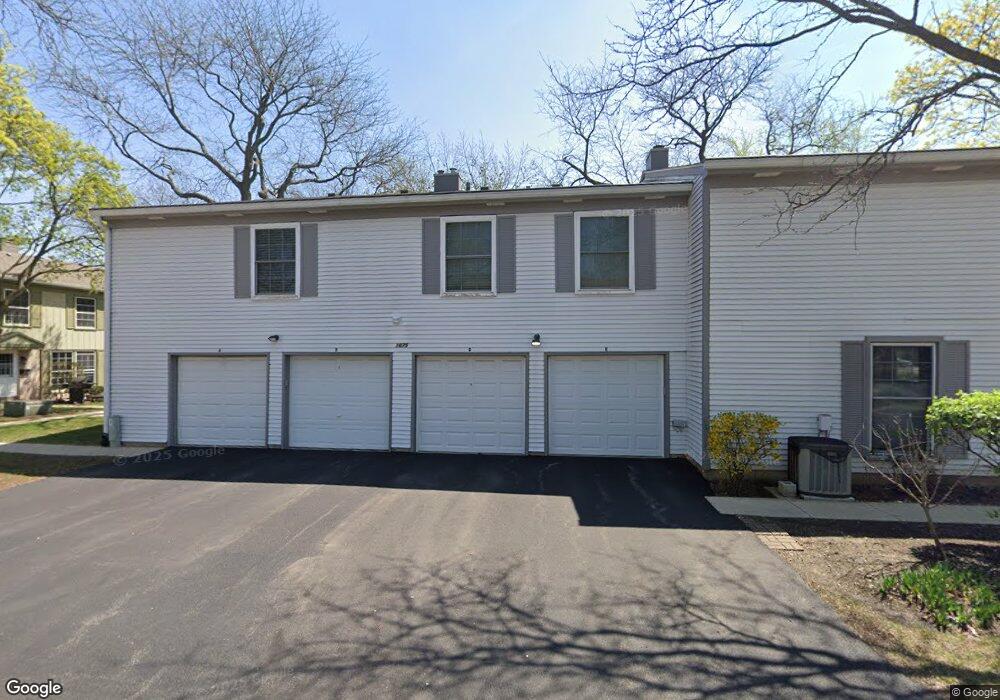
1675 Valley Forge Ct Unit B Wheaton, IL 60189
North Danada NeighborhoodEstimated Value: $240,715 - $284,000
2
Beds
1
Bath
968
Sq Ft
$270/Sq Ft
Est. Value
About This Home
This home is located at 1675 Valley Forge Ct Unit B, Wheaton, IL 60189 and is currently estimated at $261,179, approximately $269 per square foot. 1675 Valley Forge Ct Unit B is a home located in DuPage County with nearby schools including Lincoln Elementary School, Edison Middle School, and Wheaton Warrenville South High School.
Ownership History
Date
Name
Owned For
Owner Type
Purchase Details
Closed on
Dec 2, 2010
Sold by
Stephansen Amy and Kruis Amy
Bought by
Kruis Brandon and Kruis Amy
Current Estimated Value
Purchase Details
Closed on
May 15, 2009
Sold by
Foy James T and Foy Mariann
Bought by
Stephansen Amy
Home Financials for this Owner
Home Financials are based on the most recent Mortgage that was taken out on this home.
Original Mortgage
$127,200
Outstanding Balance
$80,584
Interest Rate
4.9%
Mortgage Type
Purchase Money Mortgage
Estimated Equity
$180,595
Purchase Details
Closed on
Oct 24, 2002
Sold by
Stone Kelly and Walters Kelly S
Bought by
Foy James T and Foy Mariann
Purchase Details
Closed on
Jul 22, 1999
Sold by
Koepke Karlheinz P and Koepke Patricia A
Bought by
Walters Kelly S
Home Financials for this Owner
Home Financials are based on the most recent Mortgage that was taken out on this home.
Original Mortgage
$85,000
Interest Rate
7.54%
Create a Home Valuation Report for This Property
The Home Valuation Report is an in-depth analysis detailing your home's value as well as a comparison with similar homes in the area
Home Values in the Area
Average Home Value in this Area
Purchase History
| Date | Buyer | Sale Price | Title Company |
|---|---|---|---|
| Kruis Brandon | -- | Ctic | |
| Stephansen Amy | $159,000 | Ctic | |
| Foy James T | $1,300,000 | Midwest Title Services Llc | |
| Walters Kelly S | $100,000 | -- |
Source: Public Records
Mortgage History
| Date | Status | Borrower | Loan Amount |
|---|---|---|---|
| Open | Stephansen Amy | $127,200 | |
| Previous Owner | Walters Kelly S | $85,000 |
Source: Public Records
Tax History
| Year | Tax Paid | Tax Assessment Tax Assessment Total Assessment is a certain percentage of the fair market value that is determined by local assessors to be the total taxable value of land and additions on the property. | Land | Improvement |
|---|---|---|---|---|
| 2024 | -- | $63,358 | $6,920 | $56,438 |
| 2023 | $3,401 | $58,320 | $6,370 | $51,950 |
| 2022 | $3,361 | $54,530 | $6,020 | $48,510 |
| 2021 | $2,932 | $47,420 | $5,880 | $41,540 |
| 2020 | $2,919 | $46,970 | $5,820 | $41,150 |
| 2019 | $2,844 | $45,730 | $5,670 | $40,060 |
| 2018 | $2,578 | $41,600 | $5,340 | $36,260 |
| 2017 | $2,401 | $38,350 | $4,920 | $33,430 |
| 2016 | $2,355 | $36,810 | $4,720 | $32,090 |
| 2015 | $2,320 | $35,110 | $4,500 | $30,610 |
| 2014 | $3,139 | $44,710 | $4,470 | $40,240 |
| 2013 | $3,059 | $44,840 | $4,480 | $40,360 |
Source: Public Records
Map
Nearby Homes
- 1180 Mount Vernon Ct Unit C
- 1135 Mount Vernon Ct Unit B
- 1120 Mount Vernon Ct Unit C
- 1129 Rhodes Ct
- 570 Riva Ct
- 1026 Briarcliffe Blvd
- 1720 Lakecliffe Dr Unit A
- 1705 Lakecliffe Dr Unit D
- 1733 Harrow Ct Unit B
- 1581 Groton Ln
- 840 Sheldon Ct Unit B
- 1678 Groton Ct
- 1601 Castbourne Ct
- 1265 Windsor Dr
- 1344 S Lorraine Rd Unit C
- 1216 E Elm St
- 110 E Farnham Ln
- 429 Sandhurst Cir Unit 1
- 1019 Pershing Ave
- 1000 S Lorraine Rd Unit 214
- 1150 Mount Vernon Ct Unit E
- 1661 Farragut Ct Unit A
- 1668 Williamsburg Ct Unit E
- 1123 Bunker Hill Ct
- 1135 Mt Vernon Ct Unit A
- 1130 Mount Vernon Ct Unit E
- 1693 Ashburn Ct Unit C
- 1200 Bunker Hill Ct Unit 231
- 1664 Valley Forge Ct Unit D
- 1657 Williamsburg Ct Unit A
- 1665 Williamsburg Ct Unit D
- 1665 Williamsburg Ct Unit B
- 1662 Williamsburg Ct Unit C
- 1662 Williamsburg Ct Unit B
- 1678 Ashburn Ct Unit C
- 1657 Williamsburg Ct Unit D
- 1678 Ashburn Ct Unit B
- 1677 Trowbridge Ct Unit D
- 1697 Farragut Ct Unit C
- 1101 Bunker Hill Ct Unit D
Your Personal Tour Guide
Ask me questions while you tour the home.