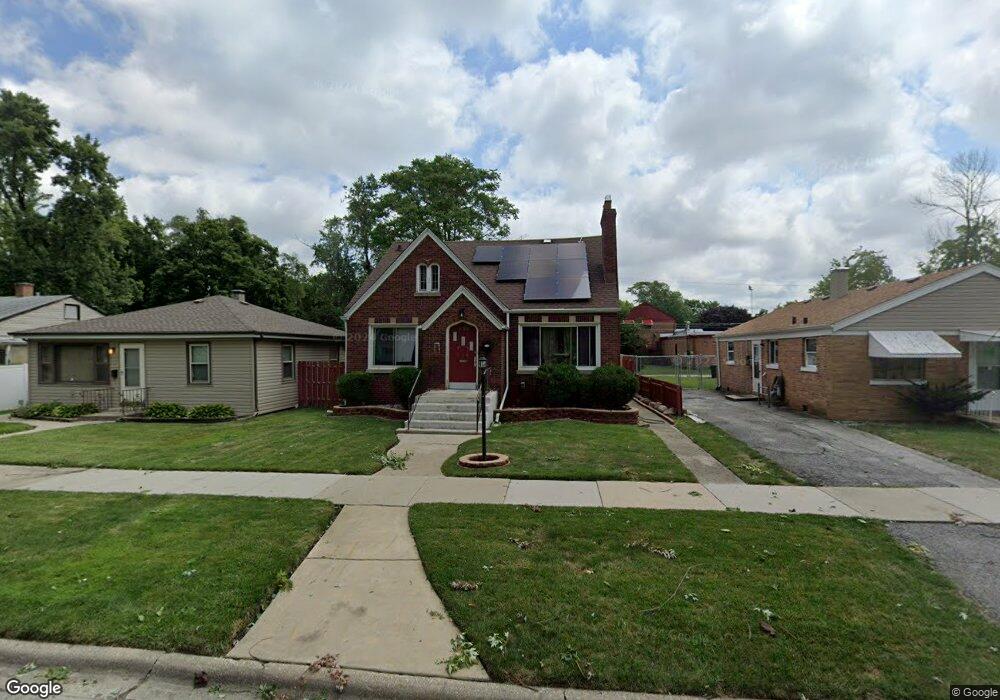
16769 Shea Ave Hazel Crest, IL 60429
Hazel Crest Proper NeighborhoodEstimated Value: $161,000 - $180,000
3
Beds
2
Baths
1,200
Sq Ft
$142/Sq Ft
Est. Value
About This Home
This home is located at 16769 Shea Ave, Hazel Crest, IL 60429 and is currently estimated at $170,055, approximately $141 per square foot. 16769 Shea Ave is a home located in Cook County with nearby schools including Thornwood High School.
Ownership History
Date
Name
Owned For
Owner Type
Purchase Details
Closed on
Aug 22, 2007
Sold by
Wilson Rodney and Rosario Mindy
Bought by
Wilson Rodney
Current Estimated Value
Home Financials for this Owner
Home Financials are based on the most recent Mortgage that was taken out on this home.
Original Mortgage
$151,235
Outstanding Balance
$95,999
Interest Rate
6.71%
Mortgage Type
New Conventional
Estimated Equity
$74,056
Purchase Details
Closed on
Jul 11, 2005
Sold by
Atg Trust Co
Bought by
Wilson Rodney and Rosario Mindy
Home Financials for this Owner
Home Financials are based on the most recent Mortgage that was taken out on this home.
Original Mortgage
$93,600
Interest Rate
6.87%
Mortgage Type
Unknown
Purchase Details
Closed on
Oct 22, 2003
Sold by
Cole Deborah
Bought by
Guaranty Trust Co and Trust #L003-066
Purchase Details
Closed on
May 29, 2002
Sold by
Labeots Betty Lee
Bought by
Great Lakes Trust Company Na and Trust #02032
Create a Home Valuation Report for This Property
The Home Valuation Report is an in-depth analysis detailing your home's value as well as a comparison with similar homes in the area
Home Values in the Area
Average Home Value in this Area
Purchase History
| Date | Buyer | Sale Price | Title Company |
|---|---|---|---|
| Wilson Rodney | -- | First American Title Ins Co | |
| Wilson Rodney | $117,000 | Atg Search | |
| Guaranty Trust Co | -- | -- | |
| Great Lakes Trust Company Na | -- | -- |
Source: Public Records
Mortgage History
| Date | Status | Borrower | Loan Amount |
|---|---|---|---|
| Open | Wilson Rodney | $151,235 | |
| Closed | Wilson Rodney | $93,600 |
Source: Public Records
Tax History Compared to Growth
Tax History
| Year | Tax Paid | Tax Assessment Tax Assessment Total Assessment is a certain percentage of the fair market value that is determined by local assessors to be the total taxable value of land and additions on the property. | Land | Improvement |
|---|---|---|---|---|
| 2024 | $2,488 | $7,200 | $1,582 | $5,618 |
| 2023 | $1,581 | $7,200 | $1,582 | $5,618 |
| 2022 | $1,581 | $5,247 | $1,356 | $3,891 |
| 2021 | $1,613 | $5,247 | $1,356 | $3,891 |
| 2020 | $1,692 | $5,247 | $1,356 | $3,891 |
| 2019 | $1,909 | $5,870 | $1,243 | $4,627 |
| 2018 | $1,853 | $5,870 | $1,243 | $4,627 |
| 2017 | $1,837 | $5,870 | $1,243 | $4,627 |
| 2016 | $1,971 | $5,414 | $1,130 | $4,284 |
| 2015 | $1,830 | $5,414 | $1,130 | $4,284 |
| 2014 | $1,842 | $5,414 | $1,130 | $4,284 |
| 2013 | $3,147 | $7,958 | $1,130 | $6,828 |
Source: Public Records
Map
Nearby Homes
- 16768 Bulger Ave
- 16707 Dixie Hwy
- 16840 Bulger Ave
- 16744 Trapet Ave
- 16918 Shea Ave
- 16727 Head Ave
- 16930 Winchester Ave
- 16780 Head Ave
- 16726 Head Ave
- 16910 Lincoln St
- 16879 Head Ave
- 16876 Head Ave
- 16963 Winchester Ave
- 2030 170th St
- 16784 Crane Ave
- 16742 Crane Ave
- 16927 Crane Ave
- 1913 170th St
- 17026 Bulger Ave
- 2131 170th St
- 16759 Shea Ave
- 16771 Shea Ave
- 16751 Shea Ave
- 16773 Shea Ave
- 16773 Shea Ave
- 16745 Shea Ave
- 16770 Dixie Hwy
- 16750 Dixie Hwy
- 16750 Dixie Hwy
- 16743 Shea Ave
- 3333 168th St
- 16774 Dixie Hwy
- 16764 Shea Ave
- 16776 Shea Ave
- 16758 Shea Ave
- 16780 Shea Ave
- 16733 Shea Ave
- 16750 Shea Ave
- 16744 Shea Ave
- 16803 Shea Ave