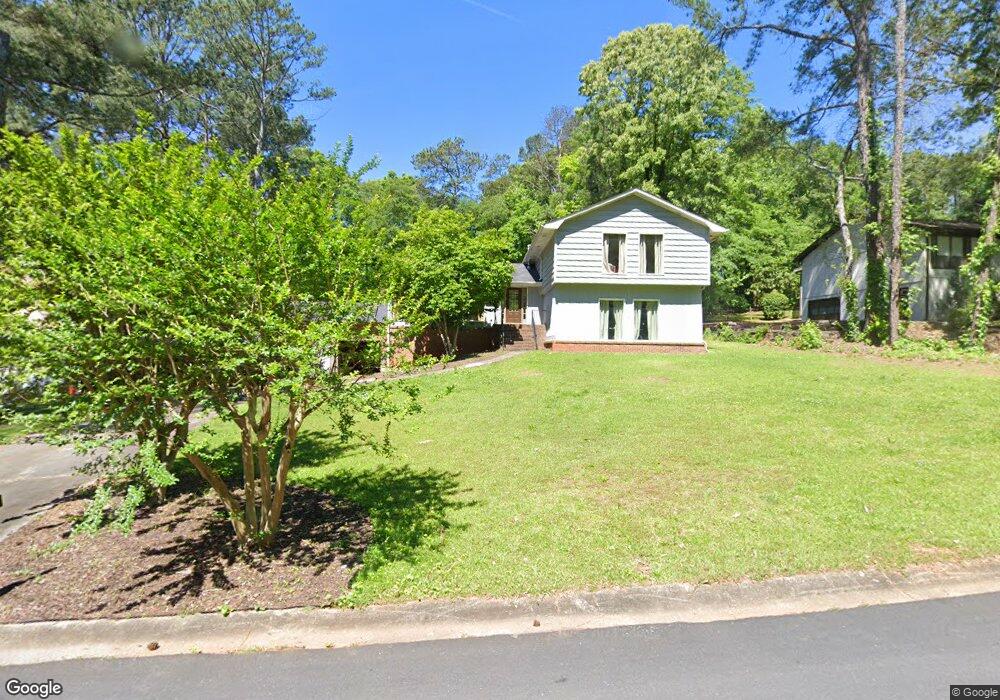
1677 Briarbend Ct Unit 4 Stone Mountain, GA 30088
Estimated Value: $294,000 - $343,000
2
Beds
3
Baths
2,441
Sq Ft
$130/Sq Ft
Est. Value
About This Home
This home is located at 1677 Briarbend Ct Unit 4, Stone Mountain, GA 30088 and is currently estimated at $316,957, approximately $129 per square foot. 1677 Briarbend Ct Unit 4 is a home located in DeKalb County with nearby schools including Woodridge Elementary School, Miller Grove Middle School, and Miller Grove High School.
Ownership History
Date
Name
Owned For
Owner Type
Purchase Details
Closed on
Apr 29, 2011
Sold by
Federal Natl Mtg Assn Fnma
Bought by
Francis Jamie
Current Estimated Value
Purchase Details
Closed on
Nov 2, 2010
Sold by
Greer Richard C
Bought by
Federal Natl Mtg Assn Fnma
Purchase Details
Closed on
Dec 12, 2002
Sold by
Gilliam G Aisha
Bought by
Greer Richard C
Home Financials for this Owner
Home Financials are based on the most recent Mortgage that was taken out on this home.
Original Mortgage
$142,500
Interest Rate
6.07%
Mortgage Type
New Conventional
Purchase Details
Closed on
Aug 9, 1994
Sold by
Secretary Of Hud
Bought by
Gilliam G Aisha
Home Financials for this Owner
Home Financials are based on the most recent Mortgage that was taken out on this home.
Original Mortgage
$112,168
Interest Rate
8.74%
Mortgage Type
FHA
Create a Home Valuation Report for This Property
The Home Valuation Report is an in-depth analysis detailing your home's value as well as a comparison with similar homes in the area
Home Values in the Area
Average Home Value in this Area
Purchase History
| Date | Buyer | Sale Price | Title Company |
|---|---|---|---|
| Francis Jamie | -- | -- | |
| Federal Natl Mtg Assn Fnma | $120,257 | -- | |
| Greer Richard C | $150,000 | -- | |
| Gilliam G Aisha | -- | -- |
Source: Public Records
Mortgage History
| Date | Status | Borrower | Loan Amount |
|---|---|---|---|
| Previous Owner | Greer Richard C | $142,500 | |
| Previous Owner | Gilliam G Aisha | $112,168 |
Source: Public Records
Tax History Compared to Growth
Tax History
| Year | Tax Paid | Tax Assessment Tax Assessment Total Assessment is a certain percentage of the fair market value that is determined by local assessors to be the total taxable value of land and additions on the property. | Land | Improvement |
|---|---|---|---|---|
| 2025 | $2,897 | $115,280 | $16,000 | $99,280 |
| 2024 | $2,784 | $109,760 | $16,000 | $93,760 |
| 2023 | $2,784 | $105,000 | $4,320 | $100,680 |
| 2022 | $2,230 | $89,480 | $4,320 | $85,160 |
| 2021 | $1,766 | $69,360 | $4,320 | $65,040 |
| 2020 | $1,537 | $59,240 | $4,320 | $54,920 |
| 2019 | $1,537 | $59,400 | $4,320 | $55,080 |
| 2018 | $1,224 | $47,320 | $4,320 | $43,000 |
| 2017 | $1,067 | $37,360 | $4,320 | $33,040 |
| 2016 | $1,170 | $43,200 | $4,320 | $38,880 |
| 2014 | $588 | $46,880 | $4,320 | $42,560 |
Source: Public Records
Map
Nearby Homes
- 1690 Briarbend Ct
- 4854 Terrace Green Trace Unit 11D
- 4889 Wedgewood Way
- 4933 Clubgreen Summit
- 1764 Big Valley Way Unit 3
- 4640 Elm Ridge Ct
- 4938 Terrace Green Trace
- 4970 Clubgreen Summit
- 1923 Manhattan Pkwy Unit 183
- 4909 Woodhurst Way
- 1406 Crooked Tree Cir
- 2014 Manhattan Pkwy
- 1513 Spruce Ridge Way
- 1830 Broadway St
- 1512 S Hairston Rd
- 4564 Cypress Ridge Ct Unit 4
- 4612 Grand Central Pkwy
- 4550 Cypress Ridge Ct
- 1491 S Hairston Rd
- 1479 Crooked Tree Cir
- 1669 Briarbend Ct
- 1685 Briarbend Ct Unit 4
- 1661 Briarbend Ct
- 1680 Briarbend Ct
- 1672 Briarbend Ct
- 1653 Briarbend Ct
- 1664 Briarbend Ct Unit 4
- 1699 Briarbend Ct
- 1672 Devon Ct
- 1706 Briarbend Ct
- 1680 Devon Ct
- 1656 Briarbend Ct
- 1645 Briarbend Ct
- 1705 Briarbend Ct
- 1759 Canberra Dr
- 1767 Canberra Dr
- 1648 Briarbend Ct
- 1664 Devon Ct
- 1751 Canberra Dr
- 1673 Devon Ct