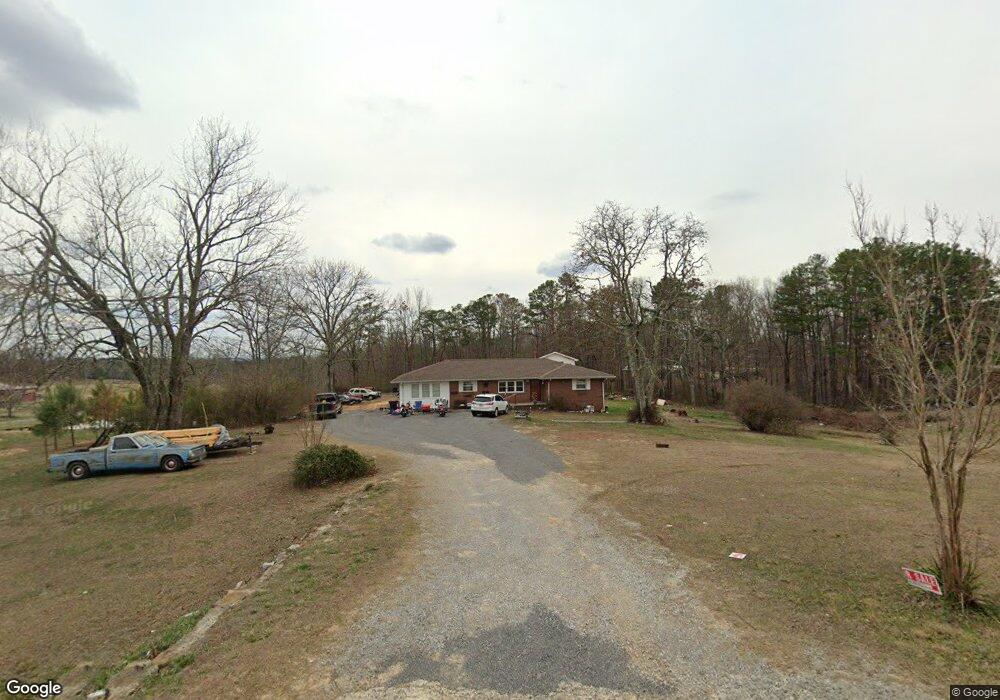
1677 New Home Loop Trenton, GA 30752
Estimated Value: $123,000 - $319,766
--
Bed
2
Baths
1,905
Sq Ft
$132/Sq Ft
Est. Value
About This Home
This home is located at 1677 New Home Loop, Trenton, GA 30752 and is currently estimated at $251,922, approximately $132 per square foot. 1677 New Home Loop is a home located in Dade County with nearby schools including Dade Middle School and Dade County High School.
Ownership History
Date
Name
Owned For
Owner Type
Purchase Details
Closed on
Sep 22, 2011
Sold by
Angela Sims-Rogers
Bought by
Sims Rogers Angela and Sims Charles Rogers
Current Estimated Value
Purchase Details
Closed on
Aug 25, 2009
Sold by
Vaughn Kenny
Bought by
Sims-Rogers Angela
Home Financials for this Owner
Home Financials are based on the most recent Mortgage that was taken out on this home.
Original Mortgage
$122,557
Interest Rate
5.19%
Mortgage Type
FHA
Purchase Details
Closed on
Nov 3, 2006
Sold by
Garner Derek S
Bought by
Vaughn Kenny and Vaughn Kimberly
Purchase Details
Closed on
Jun 22, 2006
Sold by
Garner Mary Ann
Bought by
Garner Stephen Derek
Purchase Details
Closed on
Jul 11, 1995
Sold by
Garner Clara and Garner Grego
Bought by
Garner David Eugene
Purchase Details
Closed on
Oct 30, 1979
Purchase Details
Closed on
Oct 30, 1978
Sold by
Ford Motor Credit Co
Purchase Details
Closed on
Feb 14, 1973
Purchase Details
Closed on
May 26, 1970
Sold by
Rice James Harvey
Create a Home Valuation Report for This Property
The Home Valuation Report is an in-depth analysis detailing your home's value as well as a comparison with similar homes in the area
Home Values in the Area
Average Home Value in this Area
Purchase History
| Date | Buyer | Sale Price | Title Company |
|---|---|---|---|
| Sims Rogers Angela | -- | -- | |
| Sims-Rogers Angela | $125,000 | -- | |
| Sims Rogers Angela | $125,000 | -- | |
| Sims Rogers Angela | $125,000 | -- | |
| Vaughn Kenny | -- | -- | |
| Garner Stephen Derek | -- | -- | |
| Garner David Eugene | -- | -- | |
| -- | $25,000 | -- | |
| -- | $14,100 | -- | |
| -- | $3,000 | -- | |
| -- | -- | -- |
Source: Public Records
Mortgage History
| Date | Status | Borrower | Loan Amount |
|---|---|---|---|
| Previous Owner | Sims Rogers Angela | $122,557 |
Source: Public Records
Tax History Compared to Growth
Tax History
| Year | Tax Paid | Tax Assessment Tax Assessment Total Assessment is a certain percentage of the fair market value that is determined by local assessors to be the total taxable value of land and additions on the property. | Land | Improvement |
|---|---|---|---|---|
| 2024 | $209 | $9,480 | $2,920 | $6,560 |
| 2023 | $193 | $8,640 | $2,040 | $6,600 |
| 2022 | $186 | $8,360 | $1,760 | $6,600 |
| 2021 | $171 | $7,640 | $1,760 | $5,880 |
| 2020 | $159 | $6,800 | $1,200 | $5,600 |
| 2019 | $160 | $6,800 | $1,200 | $5,600 |
| 2018 | $163 | $6,800 | $1,200 | $5,600 |
| 2017 | $163 | $6,800 | $1,200 | $5,600 |
| 2016 | $1,113 | $46,560 | $2,920 | $43,640 |
| 2015 | $1,188 | $50,880 | $5,680 | $45,200 |
| 2014 | -- | $53,840 | $5,680 | $48,160 |
| 2013 | -- | $51,200 | $5,680 | $45,520 |
Source: Public Records
Map
Nearby Homes
- 170 Teludachee Trail
- Lot 61 Teludachee Trail
- 720 Wohalie Ln
- 0 Kyuga Dr Unit 1387412
- Lot 41 Wohalie Ln
- 41 Wohalie Ln
- Lot 41 Wohalie Ln
- 0 Salolee Ln W Unit 1387413
- 0 Salolee Ln Unit 1387411
- 200 Salolee Ln
- 800 Nickajack Landing
- 0 Chesadu Cir Unit 1514507
- 0 Chesadu Cir Unit RTC2906705
- 0 S Bluffs Rd Unit 1519005
- 0 Scenic Dr Unit 1509648
- 0 Scenic Dr Unit 1509756
- 19 Megan South Way S
- 3663 New Home Rd
- 3527 New Home Rd
- 8121 Highway 156
- 1531 New Home Loop
- 1585 New Home Loop
- 22 Hazel Ln
- 27 Hazel Ln
- 56 Hazel Ln
- 1842 New Home Loop
- 1877 New Home Loop
- 67 Dennis Rd
- 60 Dennis Rd
- 1936 New Home Loop
- 76 Dennis Rd
- 1904 New Home Loop
- 1461 New Home Loop
- 45 Ford Dr
- 123 Dennis Rd
- 130 Dennis Rd
- 1581 New Home Loop
- 1778 New Home Loop
- 1488 New Home Loop
- 170 Dennis Rd