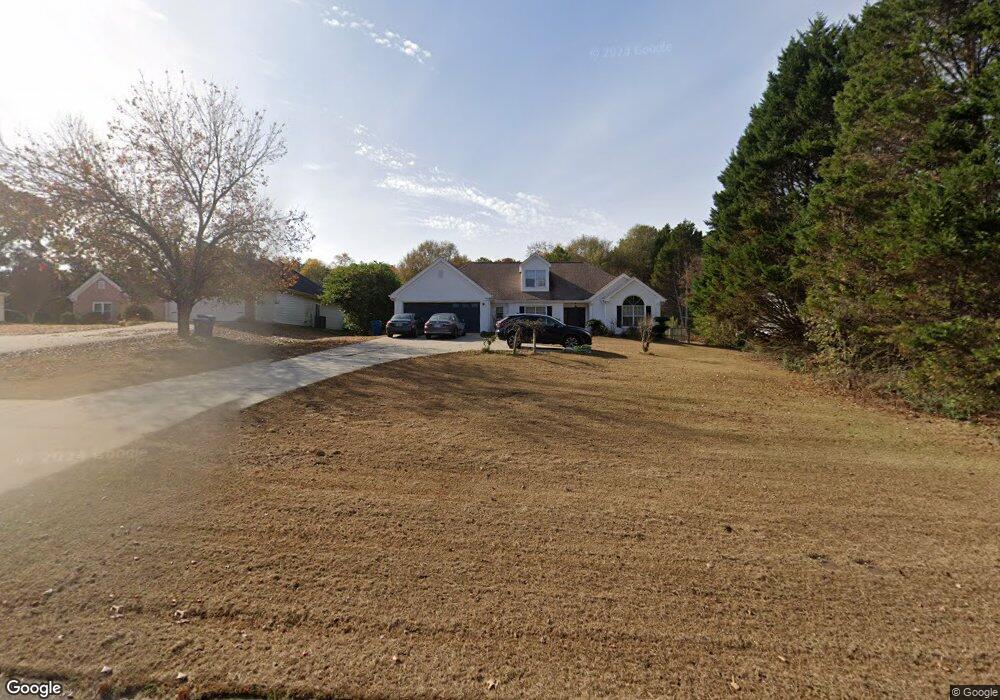
1678 Flowery Branch Rd Auburn, GA 30011
Estimated Value: $349,000 - $420,000
3
Beds
2
Baths
2,002
Sq Ft
$192/Sq Ft
Est. Value
About This Home
This home is located at 1678 Flowery Branch Rd, Auburn, GA 30011 and is currently estimated at $384,491, approximately $192 per square foot. 1678 Flowery Branch Rd is a home located in Gwinnett County with nearby schools including Duncan Creek Elementary School, Frank N. Osborne Middle School, and Mill Creek High School.
Ownership History
Date
Name
Owned For
Owner Type
Purchase Details
Closed on
Sep 5, 2003
Sold by
Han Charile
Bought by
Han Charlie and Han Mi-Hyang
Current Estimated Value
Home Financials for this Owner
Home Financials are based on the most recent Mortgage that was taken out on this home.
Original Mortgage
$146,750
Outstanding Balance
$68,452
Interest Rate
6.32%
Mortgage Type
New Conventional
Estimated Equity
$316,039
Purchase Details
Closed on
Oct 18, 2002
Sold by
Han Mi-Hyang
Bought by
Han Charlie
Home Financials for this Owner
Home Financials are based on the most recent Mortgage that was taken out on this home.
Original Mortgage
$29,000
Interest Rate
5.42%
Mortgage Type
New Conventional
Purchase Details
Closed on
Nov 1, 2000
Sold by
Han Charlie
Bought by
Han Charlie and Han Mi-Hyang
Home Financials for this Owner
Home Financials are based on the most recent Mortgage that was taken out on this home.
Original Mortgage
$140,600
Interest Rate
11.54%
Mortgage Type
New Conventional
Create a Home Valuation Report for This Property
The Home Valuation Report is an in-depth analysis detailing your home's value as well as a comparison with similar homes in the area
Home Values in the Area
Average Home Value in this Area
Purchase History
| Date | Buyer | Sale Price | Title Company |
|---|---|---|---|
| Han Charlie | -- | -- | |
| Han Charlie | -- | -- | |
| Han Charlie | -- | -- | |
| Han Charlie | $148,000 | -- |
Source: Public Records
Mortgage History
| Date | Status | Borrower | Loan Amount |
|---|---|---|---|
| Open | Han Charlie | $146,750 | |
| Previous Owner | Han Charlie | $29,000 | |
| Previous Owner | Han Charlie | $140,600 |
Source: Public Records
Tax History Compared to Growth
Tax History
| Year | Tax Paid | Tax Assessment Tax Assessment Total Assessment is a certain percentage of the fair market value that is determined by local assessors to be the total taxable value of land and additions on the property. | Land | Improvement |
|---|---|---|---|---|
| 2024 | $4,236 | $108,160 | $24,000 | $84,160 |
| 2023 | $4,236 | $108,160 | $24,000 | $84,160 |
| 2022 | $3,163 | $79,040 | $14,000 | $65,040 |
| 2021 | $3,202 | $79,040 | $14,000 | $65,040 |
| 2020 | $3,219 | $79,040 | $14,000 | $65,040 |
| 2019 | $2,859 | $71,960 | $10,000 | $61,960 |
| 2018 | $2,859 | $71,960 | $10,000 | $61,960 |
| 2016 | $2,876 | $71,960 | $10,000 | $61,960 |
| 2015 | $2,910 | $71,960 | $10,000 | $61,960 |
| 2014 | $2,523 | $60,680 | $8,000 | $52,680 |
Source: Public Records
Map
Nearby Homes
- 2088 Skybrooke Ct
- 0 Georgia 124 Unit 10590221
- 4881 Bill Cheek Rd
- 2013 Skybrooke Ln
- 1535 Moriah Trace
- 4909 Lily Stem Dr
- 4979 Lily Stem Dr
- 4849 Lily Stem Dr
- 5130 Woodline View Cir
- 1874 Granite Hill Ct
- 4685 Braselton Hwy
- 4362 Orchard Grove Dr
- 4850 Boulder Stone Way
- 4759 Highland Point Dr
- 1785 Dartford Way
- 1480 Smoke Hill Dr
- 4452 Orchard Grove Dr
- 1660 Flowery Branch Rd
- 1688 Flowery Branch Rd
- 1658 Flowery Branch Rd
- 1698 Flowery Branch Rd
- 1648 Flowery Branch Rd
- 1708 Flowery Branch Rd
- 1669 Flowery Branch Rd
- 1725 Flowery Branch Rd
- 1638 Flowery Branch Rd
- 6146 Flowery Branch Rd
- 1718 Flowery Branch Rd
- 1639 Flowery Branch Rd
- 1721 Flowery Branch Rd
- 4635 Wheeler Bend Way
- 4625 Wheeler Bend Way
- 4650 Braselton Hwy
- 1731 Flowery Branch Rd
- 4645 Wheeler Bend Way
- 4664 Braselton Hwy
- 1728 Flowery Branch Rd