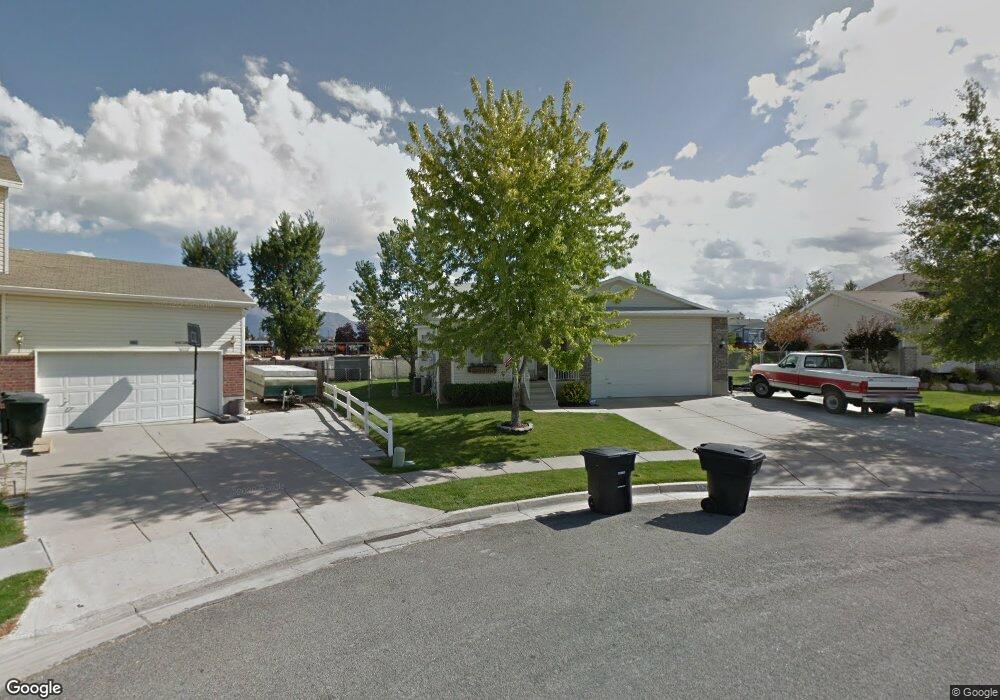
1678 N 2140 W Unit 38 Clearfield, UT 84015
Estimated Value: $466,000 - $513,000
3
Beds
2
Baths
2,488
Sq Ft
$198/Sq Ft
Est. Value
About This Home
This home is located at 1678 N 2140 W Unit 38, Clearfield, UT 84015 and is currently estimated at $492,788, approximately $198 per square foot. 1678 N 2140 W Unit 38 is a home located in Davis County with nearby schools including Parkside Elementary School, West Point Junior High School, and Clearfield High School.
Ownership History
Date
Name
Owned For
Owner Type
Purchase Details
Closed on
Feb 27, 2017
Sold by
Helbach Brian and Helbach Sharon
Bought by
Kemp Morgan R and Kemp Lesila
Current Estimated Value
Purchase Details
Closed on
Mar 2, 2006
Sold by
Tracy James A and Tracy Dana L
Bought by
Helbach Brian and Helbach Sharon
Home Financials for this Owner
Home Financials are based on the most recent Mortgage that was taken out on this home.
Original Mortgage
$188,313
Interest Rate
6.08%
Mortgage Type
VA
Purchase Details
Closed on
Mar 5, 1998
Sold by
Mark Higley Construction Lc
Bought by
Tracy James A and Tracy Dana L
Home Financials for this Owner
Home Financials are based on the most recent Mortgage that was taken out on this home.
Original Mortgage
$119,052
Interest Rate
6.99%
Mortgage Type
FHA
Create a Home Valuation Report for This Property
The Home Valuation Report is an in-depth analysis detailing your home's value as well as a comparison with similar homes in the area
Home Values in the Area
Average Home Value in this Area
Purchase History
| Date | Buyer | Sale Price | Title Company |
|---|---|---|---|
| Kemp Morgan R | -- | -- | |
| Helbach Brian | -- | First American Title | |
| Tracy James A | -- | First American Title Co |
Source: Public Records
Mortgage History
| Date | Status | Borrower | Loan Amount |
|---|---|---|---|
| Previous Owner | Helbach Brian | $188,313 | |
| Previous Owner | Tracy James A | $119,052 |
Source: Public Records
Tax History Compared to Growth
Tax History
| Year | Tax Paid | Tax Assessment Tax Assessment Total Assessment is a certain percentage of the fair market value that is determined by local assessors to be the total taxable value of land and additions on the property. | Land | Improvement |
|---|---|---|---|---|
| 2025 | -- | $254,650 | $86,993 | $167,657 |
| 2024 | -- | $245,300 | $95,964 | $149,336 |
| 2023 | -- | $431,000 | $108,586 | $322,414 |
| 2022 | $1,721 | $253,550 | $67,156 | $186,394 |
| 2021 | $1,721 | $337,000 | $82,833 | $254,167 |
| 2020 | $1,721 | $289,000 | $69,736 | $219,264 |
| 2019 | $1,721 | $271,000 | $82,697 | $188,303 |
| 2018 | $0 | $249,000 | $70,008 | $178,992 |
| 2016 | $1,566 | $112,750 | $27,124 | $85,626 |
| 2015 | $2,240 | $110,385 | $27,124 | $83,261 |
| 2014 | $1,567 | $108,945 | $27,124 | $81,821 |
| 2013 | $1,484 | $101,639 | $25,731 | $75,908 |
Source: Public Records
Map
Nearby Homes
- 1694 N 2225 W
- 2148 W 1570 N
- 2259 W 1800 N
- 1665 N 1960 W
- 1458 N 2400 W
- 2616 N 2125 W Unit 147
- 1509 N 2475 W
- 1449 N 2475 W
- 1923 W 1340 N
- 1331 N 1850 W
- 2371 W 1300 N
- 2162 N 2290 W
- 2083 W 2220 N
- 2642 W 1500 N
- 2184 N 2000 W
- Harvard Plan at Summerfield - Enclave
- 2208 W 2615 N
- Linden Plan at Summerfield - Vista
- Yale Plan at Summerfield - Enclave
- Gambel Oak Plan at Summerfield - Vista
- 1678 N 2140 W
- 1662 N 2140 W
- 2136 W 1680 N
- 2136 W 1680 N Unit 37
- 1656 N 2140 W
- 2142 W 1680 N
- 2142 W 1680 N Unit 36
- 2151 W 1680 N
- 1663 N 2140 W
- 2094 W 1630 N
- 2094 W 1630 N Unit 43
- 2154 W 1680 N
- 1634 N 2140 W
- 2122 W 1630 N Unit 41
- 2122 W 1630 N
- 2163 W 1680 N
- 1641 N 2140 W
- 2106 W 1630 N
- 2176 W 1680 N
- 2158 W 1630 N