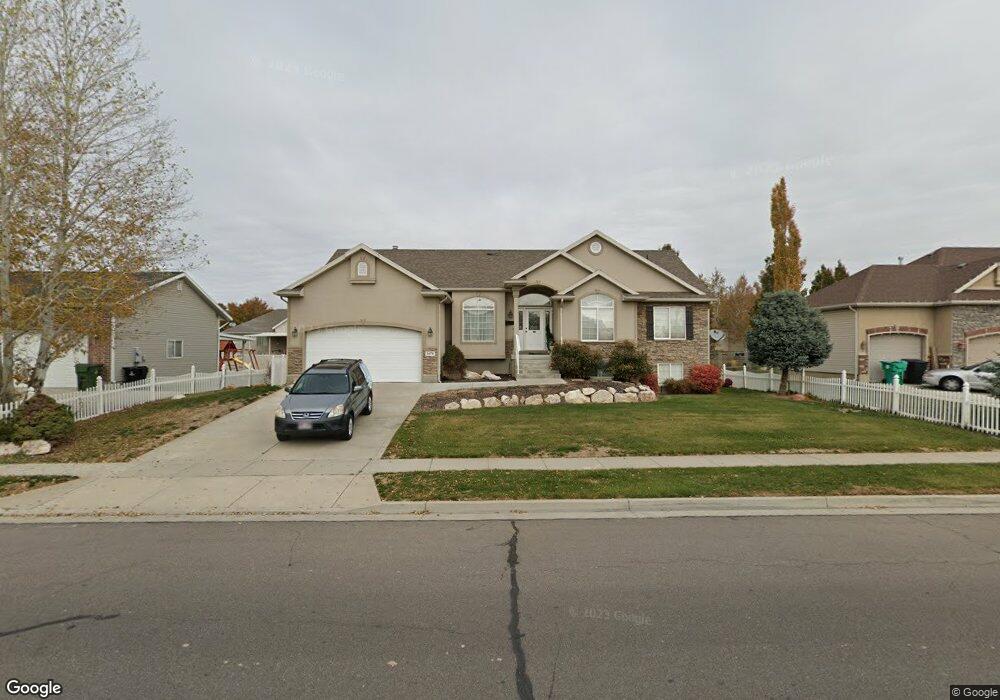
1678 W 2175 S Syracuse, UT 84075
Estimated Value: $595,000 - $618,000
3
Beds
3
Baths
1,768
Sq Ft
$344/Sq Ft
Est. Value
About This Home
This home is located at 1678 W 2175 S, Syracuse, UT 84075 and is currently estimated at $608,170, approximately $343 per square foot. 1678 W 2175 S is a home located in Davis County with nearby schools including Cook School, Syracuse Junior High School, and Syracuse High School.
Ownership History
Date
Name
Owned For
Owner Type
Purchase Details
Closed on
Mar 27, 2024
Sold by
Mortensen Family Revocable Living Trust and Fralick Janet M
Bought by
Mortensen Bryan A and Mortensen Judy L
Current Estimated Value
Home Financials for this Owner
Home Financials are based on the most recent Mortgage that was taken out on this home.
Original Mortgage
$100,000
Outstanding Balance
$98,380
Interest Rate
6.77%
Mortgage Type
New Conventional
Estimated Equity
$509,790
Purchase Details
Closed on
Feb 5, 2021
Sold by
Mortensen W Keith and Ione H Mortensen Family Protec
Bought by
Mortensen W Keith W and Mortensen Ione H
Purchase Details
Closed on
Oct 25, 2004
Sold by
Mortensen W Keith and Mortensen Ione H
Bought by
Mortensen Ione H and Keith Mortensen W
Purchase Details
Closed on
Oct 18, 2002
Sold by
Nilson & Company Inc
Bought by
Mortensen W Keith and Mortensen Ione H
Home Financials for this Owner
Home Financials are based on the most recent Mortgage that was taken out on this home.
Original Mortgage
$162,632
Interest Rate
6.05%
Create a Home Valuation Report for This Property
The Home Valuation Report is an in-depth analysis detailing your home's value as well as a comparison with similar homes in the area
Home Values in the Area
Average Home Value in this Area
Purchase History
| Date | Buyer | Sale Price | Title Company |
|---|---|---|---|
| Mortensen Bryan A | -- | Stewart Title | |
| Mortensen W Keith W | -- | None Available | |
| Mortensen Family Revocable Living Trust | -- | None Listed On Document | |
| Mortensen Ione H | -- | -- | |
| Mortensen W Keith | -- | Bonneville Title Company Inc |
Source: Public Records
Mortgage History
| Date | Status | Borrower | Loan Amount |
|---|---|---|---|
| Open | Mortensen Bryan A | $100,000 | |
| Previous Owner | Mortensen W Keith | $162,632 |
Source: Public Records
Tax History Compared to Growth
Tax History
| Year | Tax Paid | Tax Assessment Tax Assessment Total Assessment is a certain percentage of the fair market value that is determined by local assessors to be the total taxable value of land and additions on the property. | Land | Improvement |
|---|---|---|---|---|
| 2025 | $3,175 | $306,350 | $125,024 | $181,326 |
| 2024 | $3,143 | $305,250 | $103,457 | $201,793 |
| 2023 | $2,978 | $527,000 | $144,152 | $382,848 |
| 2022 | $3,112 | $301,950 | $82,972 | $218,978 |
| 2021 | $2,823 | $424,000 | $122,621 | $301,379 |
| 2020 | $2,531 | $368,000 | $106,789 | $261,211 |
| 2019 | $2,403 | $345,000 | $104,414 | $240,586 |
| 2018 | $2,253 | $321,000 | $100,824 | $220,176 |
| 2016 | $2,067 | $154,495 | $38,697 | $115,798 |
| 2015 | $2,031 | $144,540 | $38,697 | $105,843 |
| 2014 | $1,865 | $135,266 | $38,697 | $96,569 |
| 2013 | -- | $134,604 | $32,571 | $102,033 |
Source: Public Records
Map
Nearby Homes