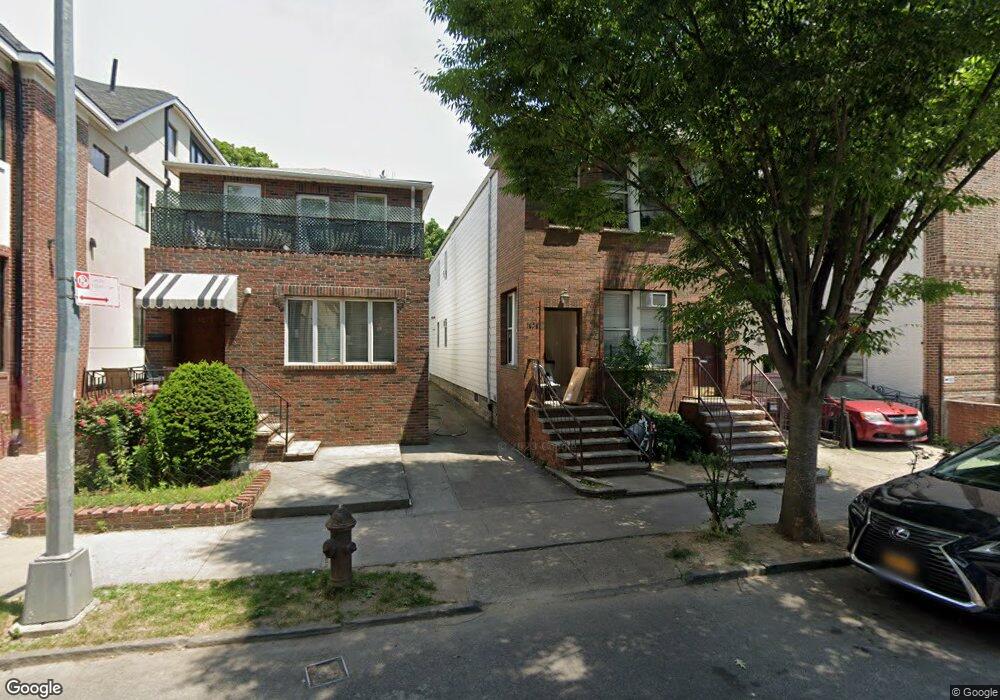
1679 53rd St Brooklyn, NY 11204
Borough Park NeighborhoodEstimated Value: $1,943,000 - $3,236,000
Studio
--
Bath
2,584
Sq Ft
$934/Sq Ft
Est. Value
About This Home
This home is located at 1679 53rd St, Brooklyn, NY 11204 and is currently estimated at $2,414,570, approximately $934 per square foot. 1679 53rd St is a home located in Kings County with nearby schools including The Seeall Academy, I.S. 223 The Montauk, and Franklin Delano Roosevelt High School.
Ownership History
Date
Name
Owned For
Owner Type
Purchase Details
Closed on
Oct 18, 2010
Sold by
Leitman Bela and Leitman Jack
Bought by
53-1677 Llc
Current Estimated Value
Purchase Details
Closed on
Sep 3, 2009
Sold by
Leitman Ellen
Bought by
Leitman Ellen and Leitman Jack
Purchase Details
Closed on
Jul 15, 1998
Sold by
Leitman Jack
Bought by
Leitman Ellen
Purchase Details
Closed on
May 28, 1998
Sold by
Hertz Robert
Bought by
Leitman Ellen
Create a Home Valuation Report for This Property
The Home Valuation Report is an in-depth analysis detailing your home's value as well as a comparison with similar homes in the area
Home Values in the Area
Average Home Value in this Area
Purchase History
| Date | Buyer | Sale Price | Title Company |
|---|---|---|---|
| 53-1677 Llc | -- | -- | |
| 53-1677 Llc | -- | -- | |
| Leitman Ellen | -- | -- | |
| Leitman Ellen | -- | -- | |
| Leitman Ellen | -- | -- | |
| Leitman Ellen | -- | -- | |
| Leitman Ellen | $57,500 | Commonwealth Land Title Ins | |
| Leitman Ellen | $57,500 | Commonwealth Land Title Ins |
Source: Public Records
Tax History
| Year | Tax Paid | Tax Assessment Tax Assessment Total Assessment is a certain percentage of the fair market value that is determined by local assessors to be the total taxable value of land and additions on the property. | Land | Improvement |
|---|---|---|---|---|
| 2025 | $10,235 | $118,620 | $30,900 | $87,720 |
| 2024 | $10,235 | $93,720 | $30,900 | $62,820 |
| 2023 | $10,349 | $107,340 | $30,900 | $76,440 |
| 2022 | $7,572 | $103,440 | $30,900 | $72,540 |
| 2021 | $10,041 | $107,880 | $30,900 | $76,980 |
| 2020 | $4,709 | $100,680 | $30,900 | $69,780 |
| 2019 | $8,883 | $100,680 | $30,900 | $69,780 |
| 2018 | $8,657 | $42,466 | $9,733 | $32,733 |
| 2017 | $8,591 | $42,144 | $15,242 | $26,902 |
| 2016 | $7,948 | $39,759 | $16,381 | $23,378 |
| 2015 | $4,795 | $37,509 | $23,170 | $14,339 |
| 2014 | $4,795 | $35,389 | $26,153 | $9,236 |
Source: Public Records
Map
Nearby Homes
- 1692 52nd St
- 1768 55th St
- 1772 55th St
- 943 McDonald Ave
- 5602 New Utrecht Ave
- 5812 New Utrecht Ave
- 1831 62nd St
- 1323 46th St Unit 5C
- 1129 McDonald Ave
- 819 McDonald Ave
- 821 McDonald Ave
- 6109 19th Ave
- 1026 E 2nd St
- 6420 16th Ave
- 1545 65th St
- 1732 65th St
- 1679 66th St
- 123 Avenue J
- 755 McDonald Ave
- 1553 39th St
Your Personal Tour Guide
Ask me questions while you tour the home.