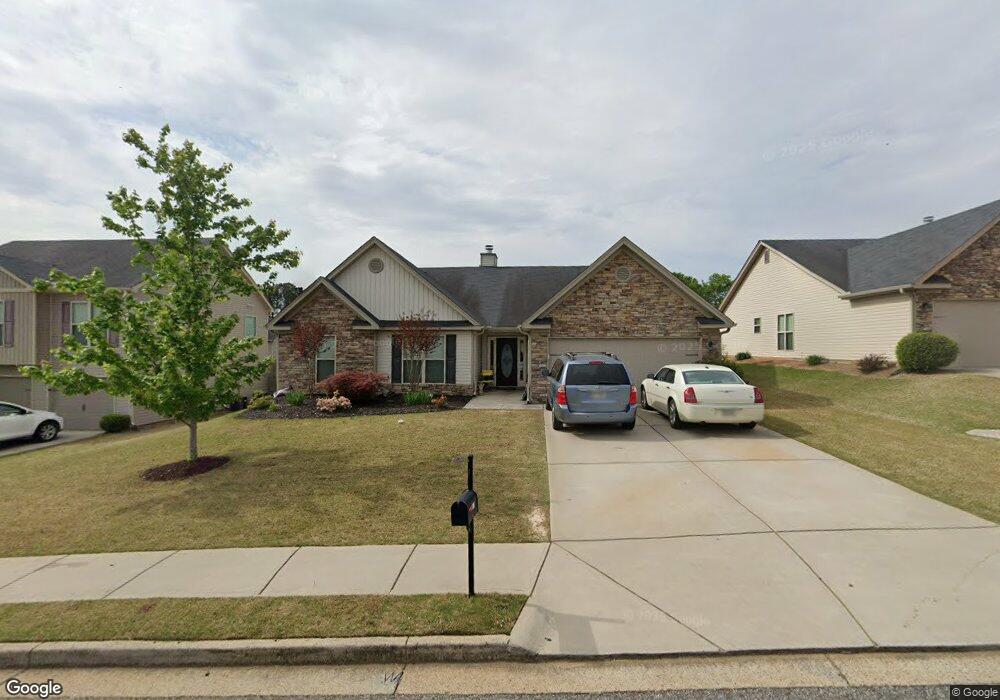
1679 Dillard Way Bethlehem, GA 30620
Estimated Value: $353,106 - $387,000
Studio
--
Bath
2,159
Sq Ft
$169/Sq Ft
Est. Value
About This Home
This home is located at 1679 Dillard Way, Bethlehem, GA 30620 and is currently estimated at $364,527, approximately $168 per square foot. 1679 Dillard Way is a home with nearby schools including Yargo Elementary School, Haymon-Morris Middle School, and Apalachee High School.
Ownership History
Date
Name
Owned For
Owner Type
Purchase Details
Closed on
Jul 11, 2014
Sold by
Southfork Homes Llc
Bought by
Leary Lilli L
Current Estimated Value
Home Financials for this Owner
Home Financials are based on the most recent Mortgage that was taken out on this home.
Original Mortgage
$123,100
Outstanding Balance
$93,296
Interest Rate
4.26%
Mortgage Type
New Conventional
Estimated Equity
$271,231
Purchase Details
Closed on
Sep 13, 2013
Sold by
Res-Ga Montreaux Llc
Bought by
Southfork Homes Llc
Purchase Details
Closed on
Oct 5, 2011
Sold by
First Citizens Bank And Trust
Bought by
Res-Ga Montreaux Llc
Purchase Details
Closed on
May 4, 2010
Sold by
Damascus Homes Llc
Bought by
First Citizens Bank And Trust Co Inc
Purchase Details
Closed on
Jan 12, 2007
Sold by
Montana Land Development Inc
Bought by
Damascus Homes Llc
Purchase Details
Closed on
May 10, 2005
Sold by
Montana Development Inc
Bought by
Montana Land Development Inc
Create a Home Valuation Report for This Property
The Home Valuation Report is an in-depth analysis detailing your home's value as well as a comparison with similar homes in the area
Home Values in the Area
Average Home Value in this Area
Purchase History
| Date | Buyer | Sale Price | Title Company |
|---|---|---|---|
| Leary Lilli L | $153,900 | -- | |
| Southfork Homes Llc | $10,000 | -- | |
| Res-Ga Montreaux Llc | $2,900 | -- | |
| First Citizens Bank And Trust Co Inc | -- | -- | |
| Damascus Homes Llc | $1,696,600 | -- | |
| Montana Land Development Inc | $2,192,300 | -- |
Source: Public Records
Mortgage History
| Date | Status | Borrower | Loan Amount |
|---|---|---|---|
| Open | Leary Lilli L | $123,100 |
Source: Public Records
Tax History
| Year | Tax Paid | Tax Assessment Tax Assessment Total Assessment is a certain percentage of the fair market value that is determined by local assessors to be the total taxable value of land and additions on the property. | Land | Improvement |
|---|---|---|---|---|
| 2025 | $1,938 | $136,607 | $26,000 | $110,607 |
| 2024 | $1,973 | $133,251 | $26,000 | $107,251 |
| 2023 | $1,577 | $133,651 | $26,000 | $107,651 |
| 2022 | $1,705 | $113,393 | $26,000 | $87,393 |
| 2021 | $2,579 | $83,644 | $18,000 | $65,644 |
| 2020 | $2,423 | $78,208 | $18,000 | $60,208 |
| 2019 | $2,466 | $78,208 | $18,000 | $60,208 |
| 2018 | $2,298 | $73,489 | $16,000 | $57,489 |
| 2017 | $1,796 | $61,676 | $16,000 | $45,676 |
| 2016 | $1,877 | $60,079 | $16,000 | $44,079 |
| 2015 | $1,885 | $60,079 | $16,000 | $44,079 |
| 2014 | $122 | $2,400 | $2,400 | $0 |
| 2013 | -- | $2,400 | $2,400 | $0 |
Source: Public Records
Map
Nearby Homes
- 209 Angie Way
- 907 Downing Dr
- 923 Downing Dr
- 1129 Loganville Hwy
- 1256 Loganville Hwy
- 627 Bridle Creek Dr
- 449 Carl Bethlehem Rd SW
- 1188 Carl-Bethlehem Rd
- 611 Mcdowell Ln
- 738 Worth Ct
- 724 Westbury Dr
- 1202 Benton Ct
- 732 Ridgeland Rd
- 713 Carl Bethlehem Rd
- 236 Vision St
- 176 Market St
- 14 Smithwood Dr
- 1309 Tom Miller Rd
- 631 Saddle Ridge Dr
- 29 Padley Dr
- 1681 Dillard Way
- 1677 Dillard Way
- 1450 Dillard Heights Dr
- 1685 Dillard Way
- 1452 Dillard Heights Dr
- 1675 Dillard Way
- 1448 Dillard Heights Dr
- 1081 Dillard Ct
- 1680 Dillard Way
- 1454 Dillard Heights Dr
- 1446 Dillard Heights Dr
- 1682 Dillard Way
- 1673 Dillard Way
- 1689 Dillard Way
- 1083 Dillard Ct
- 1684 Dillard Way
- 1444 Dillard Heights Dr Unit 6
- 1444 Dillard Heights Dr
- 1672 Dillard Way
- 1671 Dillard Way
Your Personal Tour Guide
Ask me questions while you tour the home.