Estimated Value: $524,000 - $595,000
3
Beds
3
Baths
1,222
Sq Ft
$461/Sq Ft
Est. Value
About This Home
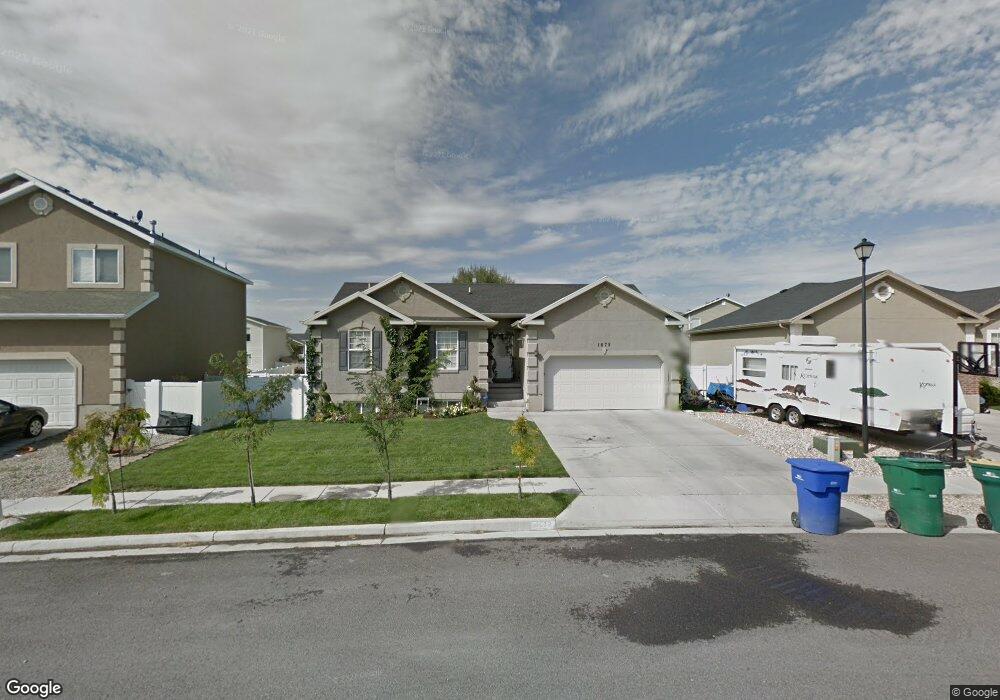
This home is located at 1679 N 2600 W, Lehi, UT 84043 and is currently estimated at $563,661, approximately $461 per square foot. 1679 N 2600 W is a home located in Utah County with nearby schools including North Point Elementary School, Willowcreek Middle School, and Lehi High School.
Ownership History
Date
Name
Owned For
Owner Type
Purchase Details
Closed on
May 11, 2011
Sold by
Richardson Melissa
Bought by
Richardson Ryan and Richardson Melissa
Current Estimated Value
Home Financials for this Owner
Home Financials are based on the most recent Mortgage that was taken out on this home.
Original Mortgage
$146,500
Outstanding Balance
$56,633
Interest Rate
4.84%
Mortgage Type
New Conventional
Estimated Equity
$507,028
Purchase Details
Closed on
Nov 20, 2003
Sold by
J2 Homes Inc
Bought by
Richardson Ryan and Richardson Melissa
Home Financials for this Owner
Home Financials are based on the most recent Mortgage that was taken out on this home.
Original Mortgage
$158,508
Interest Rate
6.04%
Mortgage Type
FHA
Purchase Details
Closed on
Jun 12, 2003
Sold by
Woodside Homes Corp
Bought by
J 2 Homes Inc
Purchase Details
Closed on
Sep 3, 2002
Sold by
Pleasant Valley Investments Lc
Bought by
Woodside Homes Corp
Create a Home Valuation Report for This Property
The Home Valuation Report is an in-depth analysis detailing your home's value as well as a comparison with similar homes in the area
Home Values in the Area
Average Home Value in this Area
Purchase History
| Date | Buyer | Sale Price | Title Company |
|---|---|---|---|
| Richardson Ryan | -- | Inwest Title Services Inc | |
| Richardson Melissa | -- | Inwest Title Services Inc | |
| Richardson Ryan | -- | Mountain West Title Co | |
| J 2 Homes Inc | -- | Mountain West Title Co | |
| Woodside Homes Corp | -- | First American Title Co |
Source: Public Records
Mortgage History
| Date | Status | Borrower | Loan Amount |
|---|---|---|---|
| Open | Richardson Melissa | $146,500 | |
| Closed | Richardson Ryan | $158,508 |
Source: Public Records
Tax History Compared to Growth
Tax History
| Year | Tax Paid | Tax Assessment Tax Assessment Total Assessment is a certain percentage of the fair market value that is determined by local assessors to be the total taxable value of land and additions on the property. | Land | Improvement |
|---|---|---|---|---|
| 2025 | $2,152 | $273,515 | $184,600 | $312,700 |
| 2024 | $2,152 | $251,900 | $0 | $0 |
| 2023 | $1,860 | $236,390 | $0 | $0 |
| 2022 | $2,117 | $260,810 | $0 | $0 |
| 2021 | $1,901 | $354,000 | $106,800 | $247,200 |
| 2020 | $1,792 | $329,900 | $98,900 | $231,000 |
| 2019 | $1,570 | $300,500 | $98,900 | $201,600 |
| 2018 | $1,592 | $288,000 | $88,200 | $199,800 |
| 2017 | $1,563 | $150,315 | $0 | $0 |
| 2016 | $1,525 | $136,070 | $0 | $0 |
| 2015 | $1,559 | $132,055 | $0 | $0 |
| 2014 | $1,468 | $123,585 | $0 | $0 |
Source: Public Records
Map
Nearby Homes
- 1696 N 2640 W
- Huntington Plan at Pioneer Meadows
- Silver Lake Plan at Pioneer Meadows
- Summit Plan at Pioneer Meadows
- Palisade Plan at Pioneer Meadows
- 1302 N 2450 W
- Accord Plan at Riverwalk
- Interlude Plan at Riverwalk
- Trio Plan at Riverwalk
- Fortissimo Plan at Riverwalk
- Ballad Plan at Riverwalk
- Tenor Plan at Riverwalk
- Madrigal Plan at Riverwalk
- Timpani Plan at Riverwalk
- Canon Plan at Riverwalk
- Browning Plan at Riverwalk
- Octave Plan at Riverwalk
- Adagio Plan at Riverwalk
- Bravo Plan at Riverwalk
- Princeton Plan at Riverwalk