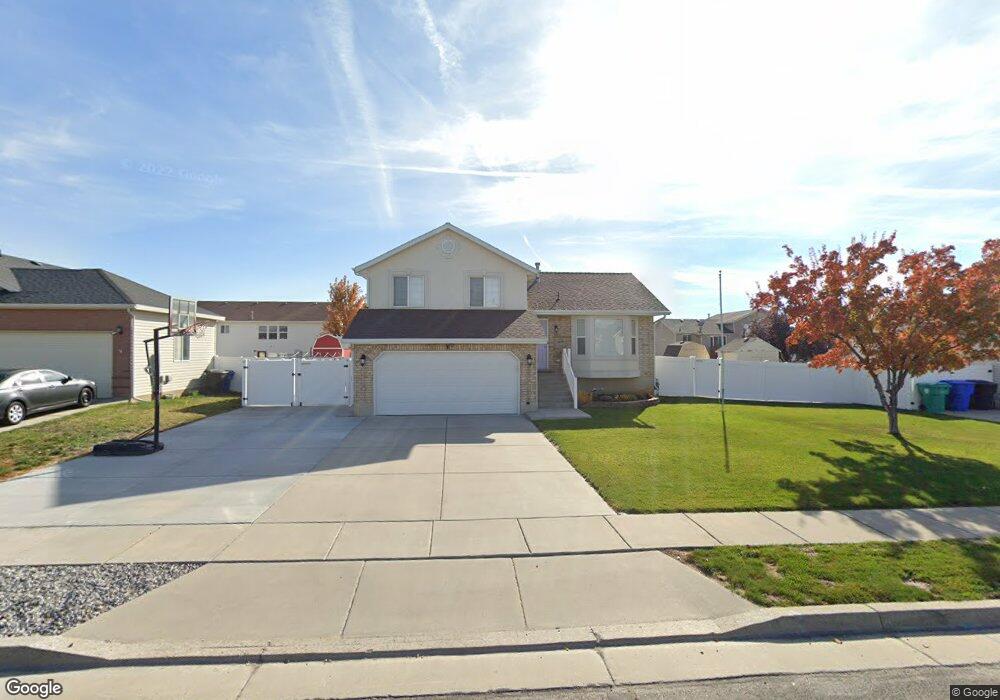
1679 W 525 N Clearfield, UT 84015
Estimated Value: $450,229 - $479,000
4
Beds
2
Baths
1,765
Sq Ft
$266/Sq Ft
Est. Value
About This Home
This home is located at 1679 W 525 N, Clearfield, UT 84015 and is currently estimated at $469,307, approximately $265 per square foot. 1679 W 525 N is a home located in Davis County with nearby schools including Lakeside School, West Point Junior High School, and Syracuse High School.
Ownership History
Date
Name
Owned For
Owner Type
Purchase Details
Closed on
Aug 29, 2018
Sold by
Kendrick Kate
Bought by
Kendrick Kate and Kendrick Larry Jay
Current Estimated Value
Purchase Details
Closed on
Nov 16, 2010
Sold by
Hizer John Earl and Hizer Patricia Anne
Bought by
Hizer John E and Hizer Patricia A
Home Financials for this Owner
Home Financials are based on the most recent Mortgage that was taken out on this home.
Original Mortgage
$164,753
Interest Rate
4.4%
Mortgage Type
FHA
Purchase Details
Closed on
Jan 29, 2004
Sold by
Freemont Investments Lc
Bought by
Hizer John Earl and Hizer Patricia Anne
Purchase Details
Closed on
Dec 2, 2003
Sold by
Freemont Investments Llc
Bought by
Faerber David M
Create a Home Valuation Report for This Property
The Home Valuation Report is an in-depth analysis detailing your home's value as well as a comparison with similar homes in the area
Home Values in the Area
Average Home Value in this Area
Purchase History
| Date | Buyer | Sale Price | Title Company |
|---|---|---|---|
| Kendrick Kate | -- | Mountain View Title | |
| Kendrick Kate | -- | Mountain View Title | |
| Hizer John E | -- | Bonneville Superior Title Co | |
| Hizer John Earl | -- | Bonneville Title Company Inc | |
| Freemont Investments Lc | -- | Bonneville Title Company Inc | |
| Faerber David M | -- | -- |
Source: Public Records
Mortgage History
| Date | Status | Borrower | Loan Amount |
|---|---|---|---|
| Previous Owner | Hizer John E | $164,753 |
Source: Public Records
Tax History Compared to Growth
Tax History
| Year | Tax Paid | Tax Assessment Tax Assessment Total Assessment is a certain percentage of the fair market value that is determined by local assessors to be the total taxable value of land and additions on the property. | Land | Improvement |
|---|---|---|---|---|
| 2025 | $2,471 | $231,550 | $101,834 | $129,716 |
| 2024 | $2,326 | $218,901 | $91,735 | $127,166 |
| 2023 | $2,241 | $388,000 | $111,129 | $276,871 |
| 2022 | $2,408 | $228,250 | $56,928 | $171,322 |
| 2021 | $2,215 | $314,000 | $92,388 | $221,612 |
| 2020 | $1,915 | $268,000 | $76,978 | $191,022 |
| 2019 | $1,877 | $259,000 | $74,872 | $184,128 |
| 2018 | $0 | $230,000 | $76,283 | $153,717 |
| 2016 | $1,451 | $103,840 | $29,454 | $74,386 |
| 2015 | $1,437 | $97,405 | $29,454 | $67,951 |
| 2014 | $1,305 | $89,740 | $29,454 | $60,286 |
| 2013 | $1,396 | $91,073 | $32,175 | $58,898 |
Source: Public Records
Map
Nearby Homes
- 1652 W 560 N
- 1774 W 400 N
- 1805 W 675 N
- 575 N 1350 W Unit 137
- 1350 W 300 N Unit 49
- 1350 W 300 N Unit 38
- 1350 W 300 N Unit 29
- 563 N 1350 W Unit 139
- 1832 W 725 N
- 1827 W 775 N
- 1337 W 550 N Unit 195
- 607 N 2000 W
- 423 N 1250 W Unit 118
- 417 N 1200 W Unit 84
- 47 N 1750 W
- 620 N 1100 W
- 2132 W 800 N
- 16 N 1300 W
- 12 N 2000 W Unit 1
- 1828 W 75 S