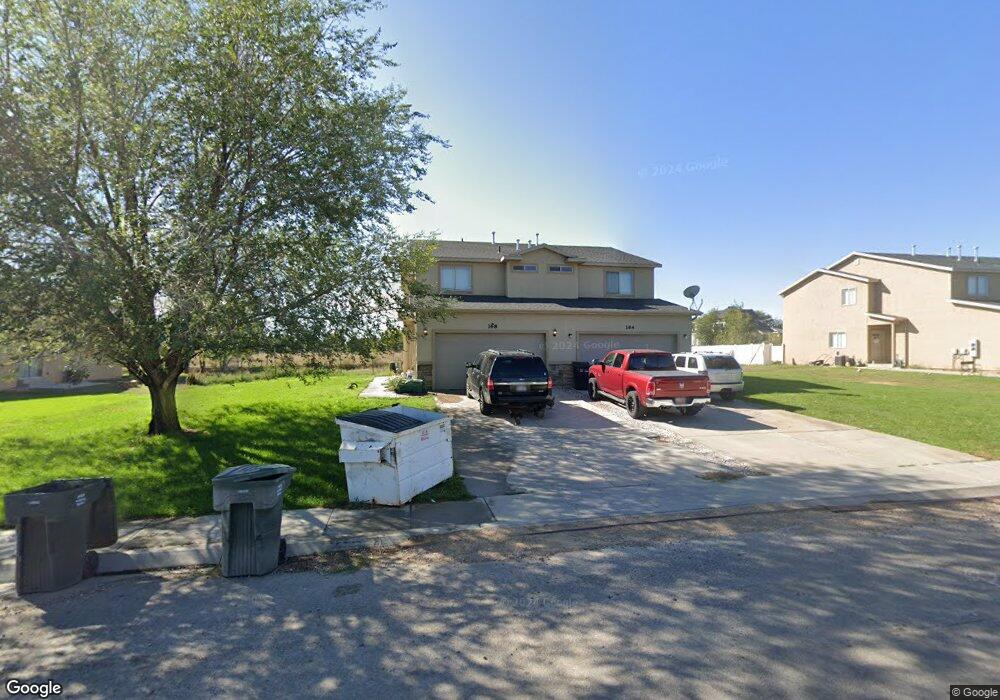
168/166 E 1150 S Vernal, UT 84078
Estimated Value: $349,000 - $485,000
--
Bed
--
Bath
3,108
Sq Ft
$136/Sq Ft
Est. Value
About This Home
This home is located at 168/166 E 1150 S, Vernal, UT 84078 and is currently estimated at $422,034, approximately $135 per square foot. 168/166 E 1150 S is a home with nearby schools including Naples School, Vernal Middle School, and Uintah Middle School.
Ownership History
Date
Name
Owned For
Owner Type
Purchase Details
Closed on
Oct 6, 2009
Sold by
Isomaki Mark R
Bought by
Isomaki Mark R and Isomaki Guada
Current Estimated Value
Purchase Details
Closed on
Apr 25, 2008
Sold by
Tri Tech Air Inc
Bought by
Isomaki Mark R
Home Financials for this Owner
Home Financials are based on the most recent Mortgage that was taken out on this home.
Original Mortgage
$279,000
Outstanding Balance
$178,803
Interest Rate
6.11%
Mortgage Type
New Conventional
Estimated Equity
$243,231
Purchase Details
Closed on
Nov 30, 2007
Sold by
Brockbank Roger R
Bought by
Tri Tech Air Inc and Red Rock Builders And Develoopment
Home Financials for this Owner
Home Financials are based on the most recent Mortgage that was taken out on this home.
Original Mortgage
$486,000
Interest Rate
6.26%
Mortgage Type
Construction
Create a Home Valuation Report for This Property
The Home Valuation Report is an in-depth analysis detailing your home's value as well as a comparison with similar homes in the area
Home Values in the Area
Average Home Value in this Area
Purchase History
| Date | Buyer | Sale Price | Title Company |
|---|---|---|---|
| Isomaki Mark R | -- | -- | |
| Isomaki Mark R | -- | -- | |
| Tri Tech Air Inc | -- | -- |
Source: Public Records
Mortgage History
| Date | Status | Borrower | Loan Amount |
|---|---|---|---|
| Open | Isomaki Mark R | $279,000 | |
| Previous Owner | Tri Tech Air Inc | $486,000 |
Source: Public Records
Tax History Compared to Growth
Tax History
| Year | Tax Paid | Tax Assessment Tax Assessment Total Assessment is a certain percentage of the fair market value that is determined by local assessors to be the total taxable value of land and additions on the property. | Land | Improvement |
|---|---|---|---|---|
| 2024 | $2,074 | $246,729 | $20,945 | $225,784 |
| 2023 | $2,074 | $212,287 | $20,945 | $191,342 |
| 2022 | $1,735 | $168,089 | $11,818 | $156,271 |
| 2021 | $1,759 | $139,909 | $11,818 | $128,091 |
| 2020 | $1,545 | $126,185 | $11,818 | $114,367 |
| 2019 | $1,563 | $126,185 | $11,818 | $114,367 |
| 2018 | $1,561 | $126,185 | $11,818 | $114,367 |
| 2017 | $17 | $136,034 | $14,772 | $121,262 |
| 2016 | $1,774 | $157,433 | $14,772 | $142,661 |
| 2015 | $1,634 | $157,433 | $14,772 | $142,661 |
| 2014 | $1,615 | $157,433 | $14,772 | $142,661 |
| 2013 | $1,650 | $157,433 | $14,772 | $142,661 |
Source: Public Records
Map
Nearby Homes