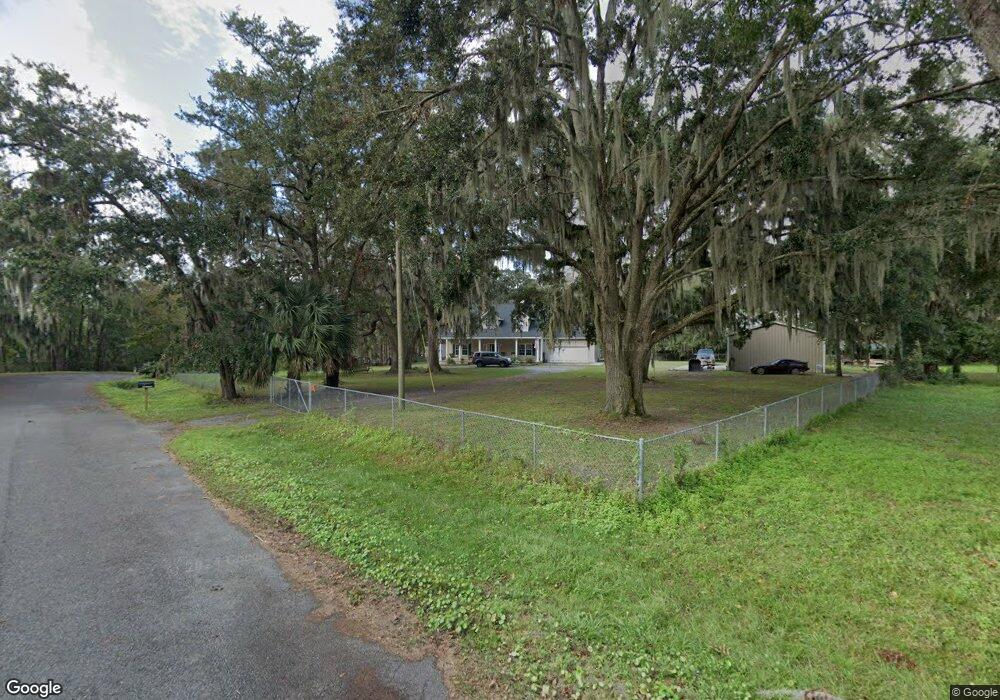
168 Cherry Ln Brunswick, GA 31523
Blythe Island NeighborhoodEstimated Value: $445,233 - $576,000
3
Beds
3
Baths
2,000
Sq Ft
$248/Sq Ft
Est. Value
About This Home
This home is located at 168 Cherry Ln, Brunswick, GA 31523 and is currently estimated at $495,308, approximately $247 per square foot. 168 Cherry Ln is a home located in Glynn County with nearby schools including Satilla Marsh Elementary School, Risley Middle School, and Glynn Academy.
Ownership History
Date
Name
Owned For
Owner Type
Purchase Details
Closed on
Sep 21, 2011
Sold by
Federal Home Loan Mortgage Corporation
Bought by
Aldrich Donnie and Aldrich Karen
Current Estimated Value
Home Financials for this Owner
Home Financials are based on the most recent Mortgage that was taken out on this home.
Original Mortgage
$182,750
Interest Rate
4.3%
Mortgage Type
Purchase Money Mortgage
Purchase Details
Closed on
Feb 1, 2011
Sold by
Hsbc Mortgage Corporation Usa
Bought by
Federal Home Loan Mortgage Corporation
Purchase Details
Closed on
Jul 28, 2009
Sold by
Pickering Andrew Alvin
Bought by
Pickering Andrew Alvin and Hesters Judy L
Home Financials for this Owner
Home Financials are based on the most recent Mortgage that was taken out on this home.
Original Mortgage
$80,000
Interest Rate
5.26%
Mortgage Type
Future Advance Clause Open End Mortgage
Create a Home Valuation Report for This Property
The Home Valuation Report is an in-depth analysis detailing your home's value as well as a comparison with similar homes in the area
Home Values in the Area
Average Home Value in this Area
Purchase History
| Date | Buyer | Sale Price | Title Company |
|---|---|---|---|
| Aldrich Donnie | $215,000 | -- | |
| Federal Home Loan Mortgage Corporation | $169,362 | -- | |
| Hsbc Mortgage Corporation Usa | $169,362 | -- | |
| Pickering Andrew Alvin | -- | -- |
Source: Public Records
Mortgage History
| Date | Status | Borrower | Loan Amount |
|---|---|---|---|
| Closed | Aldrich Donnie | $182,750 | |
| Previous Owner | Pickering Andrew Alvin | $80,000 |
Source: Public Records
Tax History Compared to Growth
Tax History
| Year | Tax Paid | Tax Assessment Tax Assessment Total Assessment is a certain percentage of the fair market value that is determined by local assessors to be the total taxable value of land and additions on the property. | Land | Improvement |
|---|---|---|---|---|
| 2025 | $4,968 | $198,080 | $11,240 | $186,840 |
| 2024 | $4,996 | $199,200 | $11,240 | $187,960 |
| 2023 | $777 | $199,200 | $11,240 | $187,960 |
| 2022 | $908 | $174,760 | $11,240 | $163,520 |
| 2021 | $935 | $135,880 | $11,240 | $124,640 |
| 2020 | $959 | $138,000 | $13,360 | $124,640 |
| 2019 | $2,773 | $126,040 | $13,360 | $112,680 |
| 2018 | $2,034 | $117,760 | $15,600 | $102,160 |
| 2017 | $2,034 | $117,760 | $15,600 | $102,160 |
| 2016 | $2,078 | $117,760 | $15,600 | $102,160 |
| 2015 | $2,090 | $117,760 | $15,600 | $102,160 |
| 2014 | $2,090 | $117,760 | $15,600 | $102,160 |
Source: Public Records
Map
Nearby Homes
- 333 Midway Cir
- 316 Brentwood Cir
- 112 Brandenberry Rd
- 103 Ashley Marsh Dr
- 132 Wandas Way
- 1446 Blythe Island Dr
- 119 Brandenberry Rd
- 411 Brentwood Cir
- 401 Brentwood Cir
- 109 Midway Cir
- 1680 Blythe Island Dr
- 111 Brook Dr
- 225 Water Crest Dr
- 554 Blythe Island Dr
- 6221 & 6225 Blythe Island Hwy
- 141 Manoe Rd
- 147 Picket Run
- 138 Picket Run
- 126 Riverwalk Dr
- 105 Riverwalk Dr
- 154 Cherry Ln
- 157 Cherry Ln
- 171 Cherry Ln
- 144 Cherry Ln
- 151 Cherry Ln
- 180 Sharon Dr
- 184 Great Egret Ln
- 136 Cherry Ln
- 120 Sharon Dr
- 195 Great Egret Ln
- 148 Sharon Dr
- 128 Cherry St
- 128 Cherry Ln
- 162 Sharon Dr
- 130 Sharon Dr
- 129 Cherry Ln
- 174 Great Egret Ln
- 183 Great Egret Ln
- 158 Parland Rd
- 176 Parland Rd