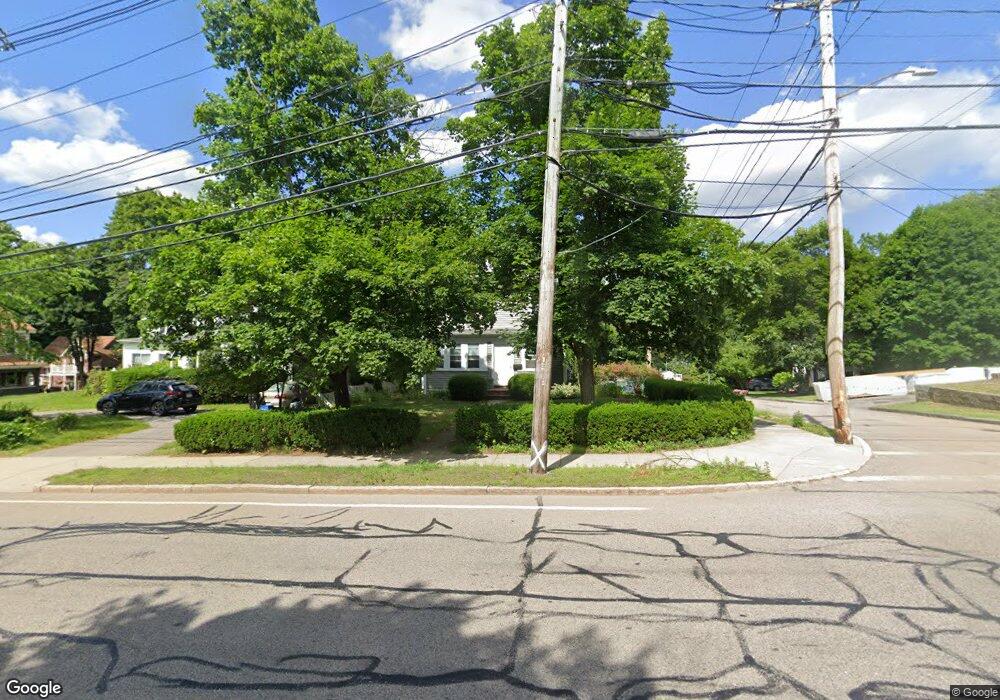
168 Common St Walpole, MA 02081
Estimated Value: $559,000 - $702,000
3
Beds
2
Baths
1,400
Sq Ft
$465/Sq Ft
Est. Value
About This Home
This home is located at 168 Common St, Walpole, MA 02081 and is currently estimated at $651,425, approximately $465 per square foot. 168 Common St is a home located in Norfolk County with nearby schools including Boyden School, Eleanor N. Johnson Middle School, and Walpole High School.
Ownership History
Date
Name
Owned For
Owner Type
Purchase Details
Closed on
Jul 27, 2005
Sold by
Mancini Diane M and Mancini Peter
Bought by
Gauthier David B and Gauthier Julie M
Current Estimated Value
Home Financials for this Owner
Home Financials are based on the most recent Mortgage that was taken out on this home.
Original Mortgage
$125,000
Outstanding Balance
$65,706
Interest Rate
5.67%
Mortgage Type
Purchase Money Mortgage
Estimated Equity
$585,719
Create a Home Valuation Report for This Property
The Home Valuation Report is an in-depth analysis detailing your home's value as well as a comparison with similar homes in the area
Home Values in the Area
Average Home Value in this Area
Purchase History
We collect this data history from publicly available records. To have your information removed, we recommend requesting removal directly through your county’s website.
| Date | Buyer | Sale Price | Title Company |
|---|---|---|---|
| Gauthier David B | $300,000 | -- |
Source: Public Records
Mortgage History
We collect this data history from publicly available records. To have your information removed, we recommend requesting removal directly through your county’s website.
| Date | Status | Borrower | Loan Amount |
|---|---|---|---|
| Open | Gauthier David B | $125,000 |
Source: Public Records
Tax History
| Year | Tax Paid | Tax Assessment Tax Assessment Total Assessment is a certain percentage of the fair market value that is determined by local assessors to be the total taxable value of land and additions on the property. | Land | Improvement |
|---|---|---|---|---|
| 2025 | $7,721 | $601,800 | $342,500 | $259,300 |
| 2024 | $7,509 | $568,000 | $329,300 | $238,700 |
| 2023 | $7,264 | $523,000 | $286,300 | $236,700 |
| 2022 | $6,840 | $473,000 | $265,200 | $207,800 |
| 2021 | $6,510 | $438,700 | $250,100 | $188,600 |
| 2020 | $6,491 | $433,000 | $236,000 | $197,000 |
| 2019 | $6,185 | $409,600 | $226,900 | $182,700 |
| 2018 | $5,807 | $380,300 | $218,100 | $162,200 |
| 2017 | $5,614 | $366,200 | $209,700 | $156,500 |
| 2016 | $5,306 | $341,000 | $201,600 | $139,400 |
| 2015 | $5,095 | $324,500 | $191,600 | $132,900 |
| 2014 | $4,941 | $313,500 | $191,600 | $121,900 |
Source: Public Records
Map
Nearby Homes
- 24 Riverside Place
- 29 Clapp St
- 404 Centre Ln
- 65-67 Diamond St
- 120 Spring St
- 11 Canvasback Way
- 16 Canvasback Way Unit 16
- 10 Country Club Dr
- 881 Main St Unit 5
- 19 Rainbow Pond Dr Unit B2
- 1108 Pennington Dr Unit 1108
- 2301 Pennington Dr Unit 2301
- 6 Teal Cir
- 19 Audubon Dr
- 29 Merganser Way Unit 29
- 2 Rainbow Pond Dr Unit 7
- 7 Lilac Ct
- 1391 Main St Unit 305
- 1391 Main St Unit 301
- 124 Clear Pond Dr
Your Personal Tour Guide
Ask me questions while you tour the home.