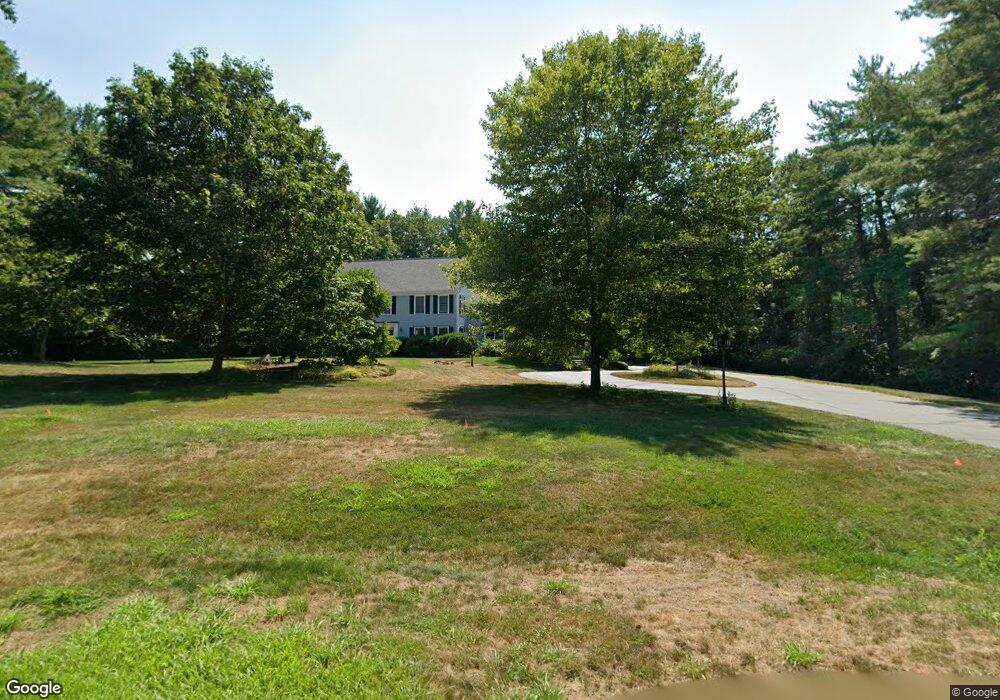
168 Davis Rd Carlisle, MA 01741
Estimated Value: $1,687,000 - $1,938,000
4
Beds
5
Baths
4,016
Sq Ft
$458/Sq Ft
Est. Value
About This Home
This home is located at 168 Davis Rd, Carlisle, MA 01741 and is currently estimated at $1,839,646, approximately $458 per square foot. 168 Davis Rd is a home located in Middlesex County with nearby schools including Carlisle School.
Ownership History
Date
Name
Owned For
Owner Type
Purchase Details
Closed on
Sep 11, 2023
Sold by
He Hongyu and Cai Cindy
Bought by
H He & Cindy Cai Lt and He
Current Estimated Value
Purchase Details
Closed on
Sep 17, 2007
Sold by
Washington Mutual Bk
Bought by
Cai Cindy and He Hongyu
Purchase Details
Closed on
Sep 14, 2007
Sold by
Nelson Joseph J and Nelson Diane
Bought by
Washington Mutual Bk
Create a Home Valuation Report for This Property
The Home Valuation Report is an in-depth analysis detailing your home's value as well as a comparison with similar homes in the area
Home Values in the Area
Average Home Value in this Area
Purchase History
| Date | Buyer | Sale Price | Title Company |
|---|---|---|---|
| H He & Cindy Cai Lt | -- | None Available | |
| Cai Cindy | $1,073,118 | -- | |
| Washington Mutual Bk | $1,026,556 | -- |
Source: Public Records
Tax History Compared to Growth
Tax History
| Year | Tax Paid | Tax Assessment Tax Assessment Total Assessment is a certain percentage of the fair market value that is determined by local assessors to be the total taxable value of land and additions on the property. | Land | Improvement |
|---|---|---|---|---|
| 2025 | $20,212 | $1,533,500 | $588,200 | $945,300 |
| 2024 | $19,648 | $1,474,000 | $544,500 | $929,500 |
| 2023 | $19,135 | $1,352,300 | $522,700 | $829,600 |
| 2022 | $19,178 | $1,162,300 | $435,600 | $726,700 |
| 2021 | $18,922 | $1,162,300 | $435,600 | $726,700 |
| 2020 | $20,295 | $1,105,400 | $370,300 | $735,100 |
| 2019 | $19,894 | $1,087,700 | $370,300 | $717,400 |
| 2018 | $19,764 | $1,087,700 | $370,300 | $717,400 |
| 2017 | $19,035 | $1,080,300 | $370,300 | $710,000 |
| 2016 | $18,454 | $1,072,900 | $370,300 | $702,600 |
| 2015 | $17,991 | $946,900 | $352,800 | $594,100 |
| 2014 | $17,650 | $946,900 | $352,800 | $594,100 |
Source: Public Records
Map
Nearby Homes
- 125 Maple St
- 282 Brook St
- 11 Kay's Walk
- 373 E Riding Dr
- 383 E Riding Dr
- 6 Edgehill Rd
- 63 Outlook Rd
- 232 Baldwin Rd
- 43 Outlook Rd
- 7 Alder Way Unit 159
- 5 Chestnut Ln Unit 120
- 4 Dove Ln
- 7 Stonegate Ln Unit 134
- 225 Lowell St
- 267 Carlisle Rd
- 3 Kay's Walk
- 15 Kay's Walk
- 1 Kay's Walk Unit 1
- 1 Kay's Walk
- 13 Kay's Walk