Estimated Value: $376,000 - $416,000
3
Beds
2
Baths
1,110
Sq Ft
$352/Sq Ft
Est. Value
About This Home
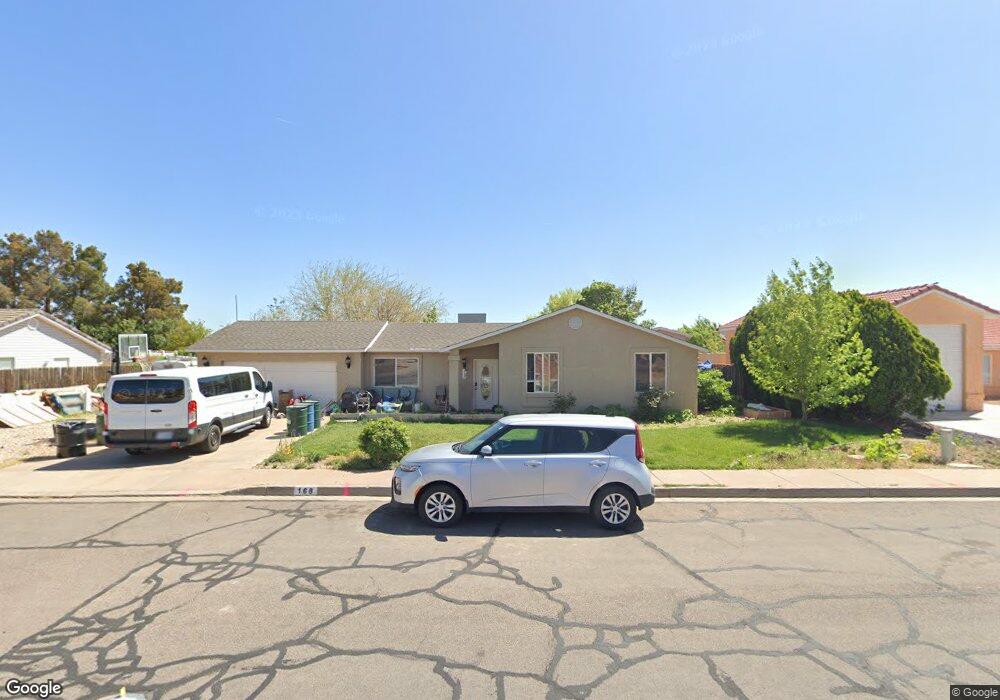
This home is located at 168 E 260 S, Ivins, UT 84738 and is currently estimated at $391,095, approximately $352 per square foot. 168 E 260 S is a home located in Washington County with nearby schools including Red Mountain School, Snow Canyon Middle School, and Lava Ridge Intermediate School.
Ownership History
Date
Name
Owned For
Owner Type
Purchase Details
Closed on
May 18, 2016
Sold by
Sooner Inc
Bought by
Kaonohi Daniel M
Current Estimated Value
Home Financials for this Owner
Home Financials are based on the most recent Mortgage that was taken out on this home.
Interest Rate
3.57%
Purchase Details
Closed on
Jan 22, 2016
Sold by
M & M Capital Llc
Bought by
Sooner Inc
Purchase Details
Closed on
Jan 21, 2016
Sold by
Jensen Jerry
Bought by
Sooner Inc
Purchase Details
Closed on
Jan 20, 2016
Sold by
Hall Dave P and Hall David Preston
Bought by
Sooner Inc Jerry Jensen M & M Capital
Create a Home Valuation Report for This Property
The Home Valuation Report is an in-depth analysis detailing your home's value as well as a comparison with similar homes in the area
Purchase History
| Date | Buyer | Sale Price | Title Company |
|---|---|---|---|
| Kaonohi Daniel M | -- | -- | |
| Sooner Inc | -- | None Available | |
| Sooner Inc | -- | None Available | |
| Sooner Inc Jerry Jensen M & M Capital | -- | None Available |
Source: Public Records
Mortgage History
| Date | Status | Borrower | Loan Amount |
|---|---|---|---|
| Closed | Kaonohi Daniel M | -- |
Source: Public Records
Tax History
| Year | Tax Paid | Tax Assessment Tax Assessment Total Assessment is a certain percentage of the fair market value that is determined by local assessors to be the total taxable value of land and additions on the property. | Land | Improvement |
|---|---|---|---|---|
| 2025 | $1,318 | $197,120 | $68,750 | $128,370 |
| 2023 | $1,361 | $199,375 | $57,750 | $141,625 |
| 2022 | $1,377 | $189,915 | $52,250 | $137,665 |
| 2021 | $1,270 | $260,300 | $65,000 | $195,300 |
| 2020 | $1,109 | $215,100 | $60,000 | $155,100 |
| 2019 | $1,073 | $203,500 | $45,000 | $158,500 |
| 2018 | $1,005 | $95,425 | $0 | $0 |
| 2017 | $933 | $88,550 | $0 | $0 |
| 2016 | $918 | $80,520 | $0 | $0 |
| 2015 | $917 | $77,440 | $0 | $0 |
| 2014 | $820 | $69,520 | $0 | $0 |
Source: Public Records
Map
Nearby Homes
Your Personal Tour Guide
Ask me questions while you tour the home.