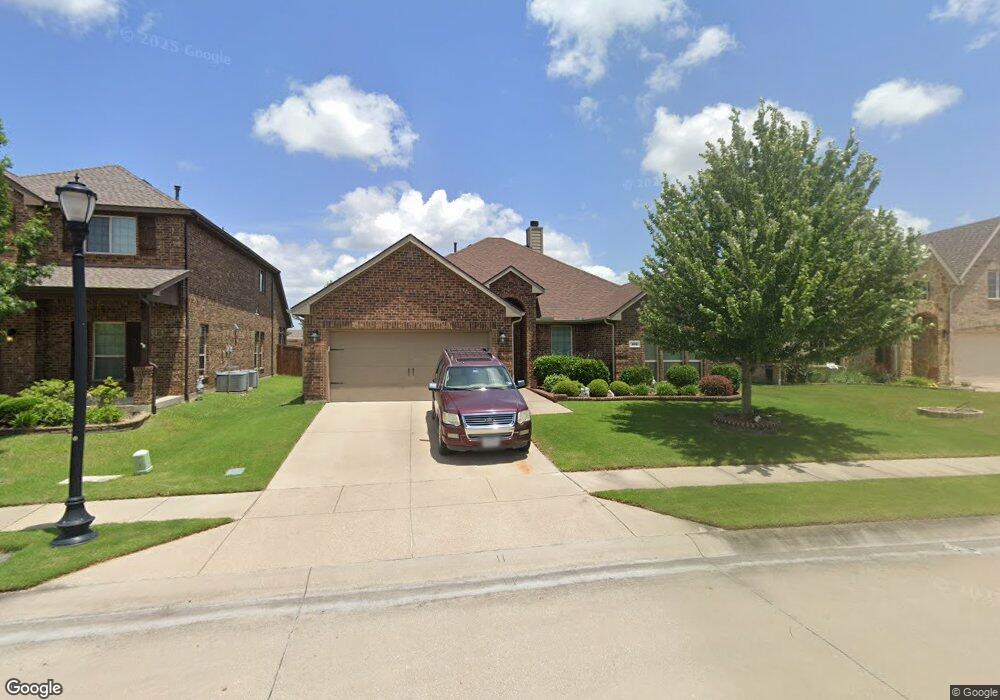
168 Griffin Ave Royse City, TX 75189
Estimated Value: $353,831 - $396,000
4
Beds
2
Baths
2,180
Sq Ft
$172/Sq Ft
Est. Value
About This Home
This home is located at 168 Griffin Ave, Royse City, TX 75189 and is currently estimated at $374,958, approximately $171 per square foot. 168 Griffin Ave is a home located in Rockwall County with nearby schools including Herman E. Utley Middle School, Rockwall-Heath High School, and Education Center International Academy Royse City.
Ownership History
Date
Name
Owned For
Owner Type
Purchase Details
Closed on
Apr 6, 2018
Sold by
Dotson Rita Ann
Bought by
Booth Shirley J
Current Estimated Value
Purchase Details
Closed on
Sep 20, 2017
Sold by
Tuff Jackie
Bought by
Dotson Rita
Home Financials for this Owner
Home Financials are based on the most recent Mortgage that was taken out on this home.
Original Mortgage
$224,800
Interest Rate
3.9%
Mortgage Type
New Conventional
Purchase Details
Closed on
Mar 20, 2014
Sold by
D R Horton Texas Ltd
Bought by
Tuff Ryan and Tuff Jackie
Home Financials for this Owner
Home Financials are based on the most recent Mortgage that was taken out on this home.
Original Mortgage
$217,149
Interest Rate
4.27%
Mortgage Type
FHA
Purchase Details
Closed on
Jul 26, 2013
Sold by
Ctmgt Williamsburg Llc
Bought by
D R Horton Texas Ltd
Create a Home Valuation Report for This Property
The Home Valuation Report is an in-depth analysis detailing your home's value as well as a comparison with similar homes in the area
Home Values in the Area
Average Home Value in this Area
Purchase History
| Date | Buyer | Sale Price | Title Company |
|---|---|---|---|
| Booth Shirley J | -- | None Available | |
| Dotson Rita | -- | None Available | |
| Tuff Ryan | -- | None Available | |
| D R Horton Texas Ltd | -- | None Available |
Source: Public Records
Mortgage History
| Date | Status | Borrower | Loan Amount |
|---|---|---|---|
| Previous Owner | Dotson Rita | $224,800 | |
| Previous Owner | Tuff Ryan | $217,149 |
Source: Public Records
Tax History Compared to Growth
Tax History
| Year | Tax Paid | Tax Assessment Tax Assessment Total Assessment is a certain percentage of the fair market value that is determined by local assessors to be the total taxable value of land and additions on the property. | Land | Improvement |
|---|---|---|---|---|
| 2025 | $5,774 | $365,047 | $126,000 | $239,047 |
| 2023 | $5,774 | $334,892 | $0 | $0 |
| 2022 | $5,483 | $304,447 | $0 | $0 |
| 2021 | $5,249 | $276,770 | $87,000 | $189,770 |
| 2020 | $5,394 | $275,800 | $70,620 | $205,180 |
| 2019 | $5,600 | $273,230 | $69,960 | $203,270 |
| 2018 | $5,567 | $267,550 | $67,980 | $199,570 |
| 2017 | $5,581 | $261,760 | $66,000 | $195,760 |
| 2016 | $5,144 | $241,290 | $66,000 | $175,290 |
| 2015 | $3,399 | $225,920 | $40,000 | $185,920 |
| 2014 | $3,399 | $98,000 | $30,000 | $68,000 |
Source: Public Records
Map
Nearby Homes
- 181 Griffin Ave
- 537 Alice Ln
- 156 Pleasant Hill Ln
- 517 Alice Ln
- 693 Kensington Place
- 179 Charleston Ln
- 493 Franklin St
- 189 Charleston Ln
- 124 Griffin Ave
- 610 Bassett Hall Rd
- 665 Bassett Hall Rd
- 206 Campbell Ct
- 304 Pleasant Hill Ln
- Hamilton II Plan at Williamsburg
- Alpine Plan at Williamsburg
- Bergamot Plan at Williamsburg
- Violet Plan at Williamsburg
- Bentworth Plan at Williamsburg
- Worcester Plan at Williamsburg
- 292 Jefferson Ln
- 170 Griffin Ave
- 166 Griffin Ave
- 172 Griffin Ave
- 164 Griffin Ave
- 163 Pleasant Hill Ln
- 167 Griffin Ave
- 169 Griffin Ave
- 159 Pleasant Hill Ln
- 165 Pleasant Hill Ln
- 161 Pleasant Hill Ln
- 174 Griffin Ave
- 171 Griffin Ave
- 157 Pleasant Hill Ln
- 162 Griffin Ave
- 167 Pleasant Hill Ln
- 165 Griffin Ave
- 155 Pleasant Hill Ln
- 163 Griffin Ave
- 176 Griffin Ave
- 169 Pleasant Hill Ln