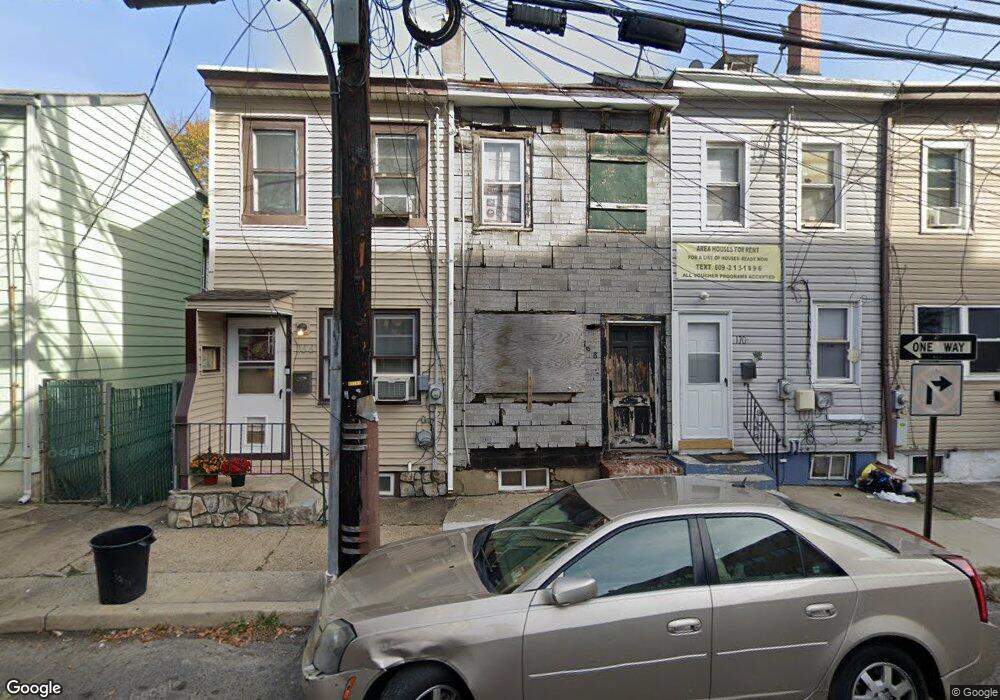
168 Hancock St Trenton, NJ 08611
South Trenton NeighborhoodEstimated Value: $109,515 - $166,000
--
Bed
--
Bath
792
Sq Ft
$179/Sq Ft
Est. Value
About This Home
This home is located at 168 Hancock St, Trenton, NJ 08611 and is currently estimated at $142,129, approximately $179 per square foot. 168 Hancock St is a home with nearby schools including Mott Elementary School, Parker Elementary School, and Dr. Crosby Copeland Elementary School.
Ownership History
Date
Name
Owned For
Owner Type
Purchase Details
Closed on
Mar 17, 2011
Sold by
The City Of Trenton
Bought by
Pellot Maribel
Current Estimated Value
Home Financials for this Owner
Home Financials are based on the most recent Mortgage that was taken out on this home.
Original Mortgage
$2,720
Interest Rate
4.84%
Mortgage Type
Seller Take Back
Purchase Details
Closed on
Mar 9, 2011
Sold by
City Of Trenton
Bought by
Boone Andrew
Home Financials for this Owner
Home Financials are based on the most recent Mortgage that was taken out on this home.
Original Mortgage
$2,720
Interest Rate
4.84%
Mortgage Type
Seller Take Back
Create a Home Valuation Report for This Property
The Home Valuation Report is an in-depth analysis detailing your home's value as well as a comparison with similar homes in the area
Home Values in the Area
Average Home Value in this Area
Purchase History
| Date | Buyer | Sale Price | Title Company |
|---|---|---|---|
| Pellot Maribel | $3,400 | Emerald Title | |
| Boone Andrew | $3,400 | None Available |
Source: Public Records
Mortgage History
| Date | Status | Borrower | Loan Amount |
|---|---|---|---|
| Previous Owner | Boone Andrew | $2,720 |
Source: Public Records
Tax History Compared to Growth
Tax History
| Year | Tax Paid | Tax Assessment Tax Assessment Total Assessment is a certain percentage of the fair market value that is determined by local assessors to be the total taxable value of land and additions on the property. | Land | Improvement |
|---|---|---|---|---|
| 2025 | $899 | $15,500 | $8,300 | $7,200 |
| 2024 | $863 | $15,500 | $8,300 | $7,200 |
| 2023 | $863 | $15,500 | $8,300 | $7,200 |
| 2022 | $846 | $15,500 | $8,300 | $7,200 |
| 2021 | $861 | $15,500 | $8,300 | $7,200 |
| 2020 | $858 | $15,500 | $8,300 | $7,200 |
| 2019 | $844 | $15,500 | $8,300 | $7,200 |
| 2018 | $808 | $15,500 | $8,300 | $7,200 |
| 2017 | $768 | $15,500 | $8,300 | $7,200 |
| 2016 | $1,484 | $25,800 | $14,700 | $11,100 |
| 2015 | $1,479 | $25,800 | $14,700 | $11,100 |
| 2014 | $1,472 | $25,800 | $14,700 | $11,100 |
Source: Public Records
Map
Nearby Homes