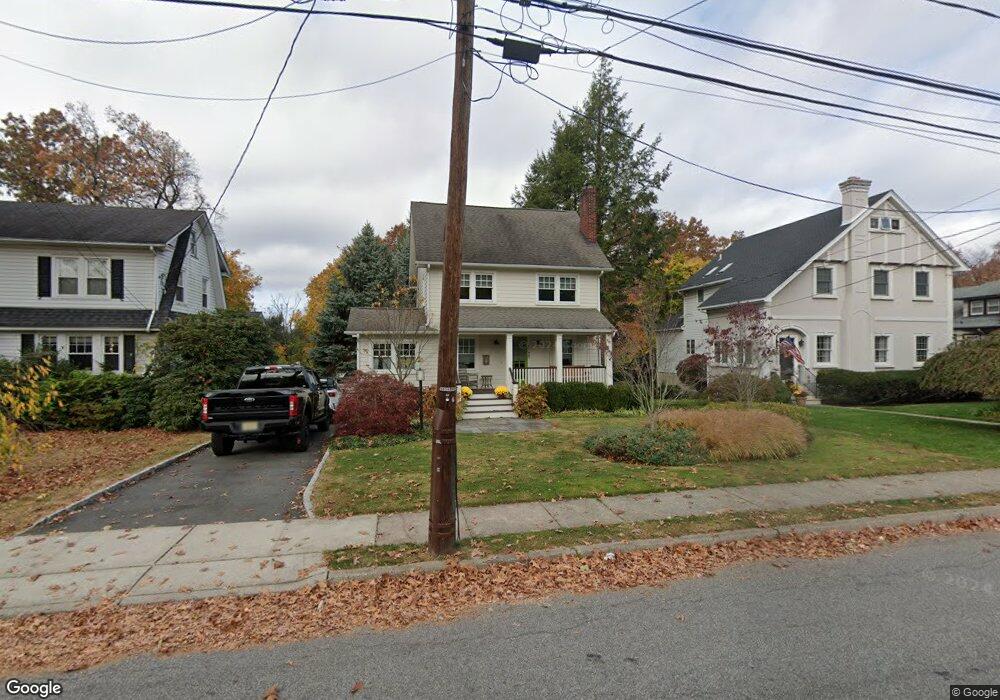
168 Harding Rd Glen Rock, NJ 07452
Estimated Value: $854,139 - $1,041,000
--
Bed
--
Bath
1,745
Sq Ft
$546/Sq Ft
Est. Value
About This Home
This home is located at 168 Harding Rd, Glen Rock, NJ 07452 and is currently estimated at $952,035, approximately $545 per square foot. 168 Harding Rd is a home located in Bergen County with nearby schools including Glen Rock Middle School, Glen Rock High School, and Academy Of Our Lady At St Catharine.
Ownership History
Date
Name
Owned For
Owner Type
Purchase Details
Closed on
Sep 17, 2001
Current Estimated Value
Purchase Details
Closed on
Dec 21, 1998
Sold by
Dobson Carol W and Dobson Edwin J
Bought by
Wells Marcy and Tyler Charles E
Home Financials for this Owner
Home Financials are based on the most recent Mortgage that was taken out on this home.
Original Mortgage
$160,000
Interest Rate
6.89%
Create a Home Valuation Report for This Property
The Home Valuation Report is an in-depth analysis detailing your home's value as well as a comparison with similar homes in the area
Home Values in the Area
Average Home Value in this Area
Purchase History
| Date | Buyer | Sale Price | Title Company |
|---|---|---|---|
| -- | -- | -- | |
| Wells Marcy | $200,000 | -- |
Source: Public Records
Mortgage History
| Date | Status | Borrower | Loan Amount |
|---|---|---|---|
| Previous Owner | Wells Marcy | $160,000 |
Source: Public Records
Tax History Compared to Growth
Tax History
| Year | Tax Paid | Tax Assessment Tax Assessment Total Assessment is a certain percentage of the fair market value that is determined by local assessors to be the total taxable value of land and additions on the property. | Land | Improvement |
|---|---|---|---|---|
| 2025 | $16,082 | $489,100 | $254,300 | $234,800 |
| 2024 | $15,456 | $489,100 | $254,300 | $234,800 |
| 2023 | $15,069 | $489,100 | $254,300 | $234,800 |
| 2022 | $15,069 | $489,100 | $254,300 | $234,800 |
| 2021 | $13,883 | $489,100 | $254,300 | $234,800 |
| 2020 | $14,913 | $489,100 | $254,300 | $234,800 |
| 2019 | $14,521 | $489,100 | $254,300 | $234,800 |
| 2018 | $14,120 | $489,100 | $254,300 | $234,800 |
| 2017 | $13,388 | $472,900 | $254,300 | $218,600 |
| 2016 | $13,194 | $472,900 | $254,300 | $218,600 |
| 2015 | $12,986 | $472,900 | $254,300 | $218,600 |
| 2014 | $12,816 | $472,900 | $254,300 | $218,600 |
Source: Public Records
Map
Nearby Homes
- 540 S Maple Ave
- 394 Ackerman Ave
- 153 Glen Ave
- 600 Doremus Ave
- 11 Carol Ct
- 472 Rock Rd
- 16 Highwood Terrace
- 14 S Highwood Ave
- 232 Doremus Ave
- 155 Main St
- 145 Midwood Rd
- 11 Lee Ave
- 211 Doremus Ave
- 674 Ackerman Ave
- 140 Bellair Rd Unit D
- 18 Locust Rd
- 253 Edwards St
- 6 Christopher Place
- 470 Prospect St
- 183 Ackerman Ave
- 164 Harding Rd
- 174 Harding Rd
- 160 Harding Rd
- 178 Harding Rd
- 156 Harding Rd
- 184 Harding Rd
- 165 Harding Rd
- 161 Harding Rd
- 171 Harding Rd
- 155 Harding Rd
- 150 Harding Rd
- 179 Harding Rd
- 188 Harding Rd
- 22 Sterling Place
- 18 Sterling Place
- 149 Harding Rd
- 183 Harding Rd
- 192 Harding Rd
- 144 Harding Rd
- 41 Iona Place