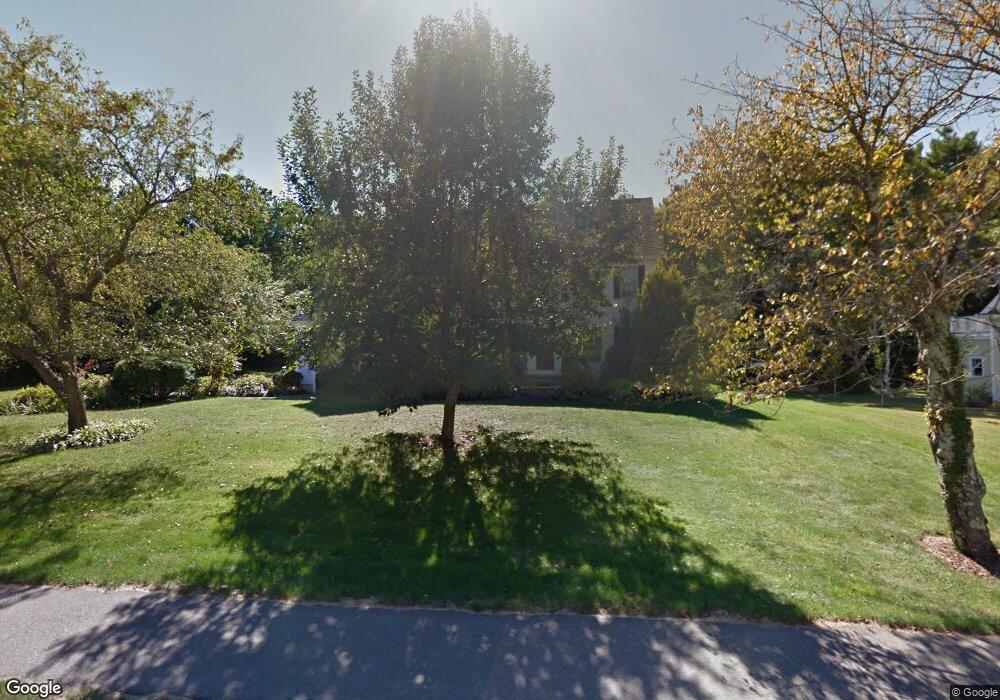
168 High Rock St Needham, MA 02492
Estimated Value: $1,613,070 - $2,043,000
4
Beds
3
Baths
1,386
Sq Ft
$1,332/Sq Ft
Est. Value
About This Home
This home is located at 168 High Rock St, Needham, MA 02492 and is currently estimated at $1,845,518, approximately $1,331 per square foot. 168 High Rock St is a home located in Norfolk County with nearby schools including Newman Elementary School, High Rock Middle School, and Pollard Middle School.
Ownership History
Date
Name
Owned For
Owner Type
Purchase Details
Closed on
Apr 24, 1998
Sold by
Reddish Edward J and Reddish Elsa H
Bought by
Kim Sun H and Kim Won O
Current Estimated Value
Home Financials for this Owner
Home Financials are based on the most recent Mortgage that was taken out on this home.
Original Mortgage
$365,000
Outstanding Balance
$69,348
Interest Rate
7.11%
Mortgage Type
Purchase Money Mortgage
Estimated Equity
$1,776,170
Purchase Details
Closed on
Jun 2, 1997
Sold by
Simpson Barbara A
Bought by
Reddish Edward J and Reddish Elsa H
Create a Home Valuation Report for This Property
The Home Valuation Report is an in-depth analysis detailing your home's value as well as a comparison with similar homes in the area
Home Values in the Area
Average Home Value in this Area
Purchase History
| Date | Buyer | Sale Price | Title Company |
|---|---|---|---|
| Kim Sun H | $615,000 | -- | |
| Reddish Edward J | $220,000 | -- |
Source: Public Records
Mortgage History
| Date | Status | Borrower | Loan Amount |
|---|---|---|---|
| Open | Reddish Edward J | $365,000 |
Source: Public Records
Tax History
| Year | Tax Paid | Tax Assessment Tax Assessment Total Assessment is a certain percentage of the fair market value that is determined by local assessors to be the total taxable value of land and additions on the property. | Land | Improvement |
|---|---|---|---|---|
| 2025 | $16,420 | $1,549,100 | $902,500 | $646,600 |
| 2024 | $14,416 | $1,151,400 | $704,500 | $446,900 |
| 2023 | $14,564 | $1,116,900 | $704,500 | $412,400 |
| 2022 | $14,640 | $1,095,000 | $704,500 | $390,500 |
| 2021 | $14,268 | $1,095,000 | $704,500 | $390,500 |
| 2020 | $14,207 | $1,137,500 | $704,600 | $432,900 |
| 2019 | $14,079 | $1,136,300 | $704,600 | $431,700 |
| 2018 | $13,499 | $1,136,300 | $704,600 | $431,700 |
| 2017 | $13,978 | $1,175,600 | $704,600 | $471,000 |
| 2016 | $13,566 | $1,175,600 | $704,600 | $471,000 |
| 2015 | $13,273 | $1,175,600 | $704,600 | $471,000 |
| 2014 | $13,521 | $1,161,600 | $704,600 | $457,000 |
Source: Public Records
Map
Nearby Homes
- 569 Chestnut St
- 47 Emerson Rd
- 287 High Rock St
- 150 Laurel Dr
- 957 South St
- 90 Norfolk St
- 53 Heather Ln
- 1011 Webster St
- 68 Pleasant St Unit 68
- 95 Deerfield Rd
- 60 Sutton Rd
- 233 Warren St
- 73 Maple St Unit 1
- 100 Bradford St
- 193 Garden St
- 620 High Rock St
- 189 Bridle Trail Rd
- 8 Crestview Rd
- 126 Prince St
- 36 Otis St Unit 36
- 178 High Rock St
- 169 High Rock St
- 71 Emerson Rd
- 158 High Rock St
- 65 Emerson Rd
- 179 High Rock St
- 74 Emerson Rd
- 57 Emerson Rd
- 68 Emerson Rd
- 144 High Rock St
- 185 High Rock St
- 62 Emerson Rd
- 563 Chestnut St
- 557 Chestnut St
- 51 Emerson Rd
- 202 High Rock St
- 191 High Rock St
- 549 Chestnut St
- 54 Emerson Rd
- 543 Chestnut St
Your Personal Tour Guide
Ask me questions while you tour the home.