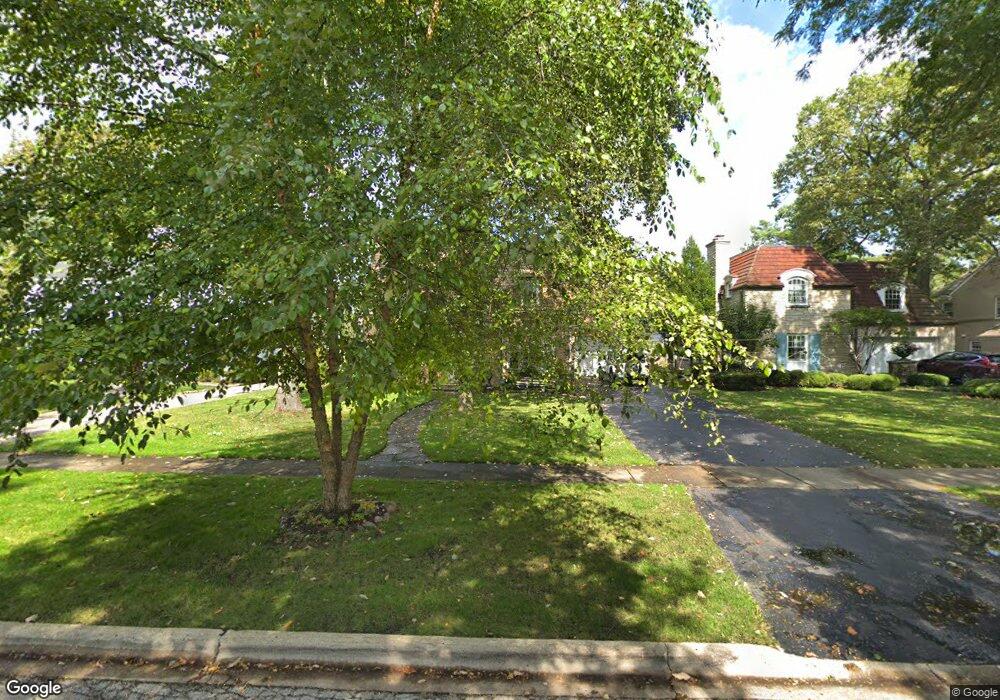
168 Indian Tree Dr Highland Park, IL 60035
East Highland Park NeighborhoodEstimated Value: $1,078,000 - $1,237,000
3
Beds
5
Baths
2,886
Sq Ft
$396/Sq Ft
Est. Value
About This Home
This home is located at 168 Indian Tree Dr, Highland Park, IL 60035 and is currently estimated at $1,143,654, approximately $396 per square foot. 168 Indian Tree Dr is a home located in Lake County with nearby schools including Braeside Elementary School, Edgewood Middle School, and Highland Park High School.
Ownership History
Date
Name
Owned For
Owner Type
Purchase Details
Closed on
Jun 21, 2007
Sold by
Rosenberg Bennett L
Bought by
Rosenberg Bennett L and Rosenberg Stacy
Current Estimated Value
Purchase Details
Closed on
Aug 1, 2001
Sold by
Loarie Debra L and Loarie James W
Bought by
Rosenberg Bennett L
Home Financials for this Owner
Home Financials are based on the most recent Mortgage that was taken out on this home.
Original Mortgage
$444,000
Outstanding Balance
$179,069
Interest Rate
7.62%
Estimated Equity
$964,585
Purchase Details
Closed on
Feb 23, 1998
Sold by
Loarie James Willard and Loarie Debra Lynn
Bought by
Loarie Debra L and Loarie James W
Purchase Details
Closed on
Sep 5, 1996
Sold by
Kleinman David and Kleinman Harriett
Bought by
Loarie James W and Loarie Debra
Home Financials for this Owner
Home Financials are based on the most recent Mortgage that was taken out on this home.
Original Mortgage
$330,750
Interest Rate
8%
Create a Home Valuation Report for This Property
The Home Valuation Report is an in-depth analysis detailing your home's value as well as a comparison with similar homes in the area
Home Values in the Area
Average Home Value in this Area
Purchase History
| Date | Buyer | Sale Price | Title Company |
|---|---|---|---|
| Rosenberg Bennett L | -- | None Available | |
| Rosenberg Bennett L | -- | 1St American Title | |
| Loarie Debra L | -- | -- | |
| Loarie James W | $367,500 | -- |
Source: Public Records
Mortgage History
| Date | Status | Borrower | Loan Amount |
|---|---|---|---|
| Open | Rosenberg Bennett L | $444,000 | |
| Previous Owner | Loarie James W | $330,750 |
Source: Public Records
Tax History Compared to Growth
Tax History
| Year | Tax Paid | Tax Assessment Tax Assessment Total Assessment is a certain percentage of the fair market value that is determined by local assessors to be the total taxable value of land and additions on the property. | Land | Improvement |
|---|---|---|---|---|
| 2024 | $22,546 | $294,005 | $91,454 | $202,551 |
| 2023 | $22,608 | $265,013 | $82,436 | $182,577 |
| 2022 | $22,608 | $257,048 | $90,561 | $166,487 |
| 2021 | $20,841 | $248,476 | $87,541 | $160,935 |
| 2020 | $20,167 | $248,476 | $87,541 | $160,935 |
| 2019 | $19,487 | $247,313 | $87,131 | $160,182 |
| 2018 | $17,051 | $229,811 | $69,180 | $160,631 |
| 2017 | $16,785 | $228,486 | $68,781 | $159,705 |
| 2016 | $14,268 | $217,523 | $65,481 | $152,042 |
| 2015 | $13,680 | $230,684 | $60,839 | $169,845 |
| 2014 | $12,276 | $180,752 | $57,970 | $122,782 |
| 2012 | $11,756 | $198,581 | $58,308 | $140,273 |
Source: Public Records
Map
Nearby Homes
- 590 Rambler Ln
- 721 Marion Ave
- 298 Leslee Ln
- 590 Melody Ln
- 847 Marion Ave
- 32 Valley Rd
- 867 Timber Hill Rd
- 325 Lincolnwood Rd
- 378 Oakland Dr
- 19 Heritage Dr
- 8 Heritage Dr
- 600 Broadview Ave
- 625 Sheridan Rd
- 732 Bronson Ln
- 1200 Green Bay Rd
- 1265 Longmeadow Ln
- 566 Bellevue Place
- 1180 Oak Ridge Dr
- 855 Sheridan Rd
- 1171 Hohlfelder Rd
- 170 Indian Tree Dr
- 166 Indian Tree Dr
- 174 Indian Tree Dr
- 164 Indian Tree Dr
- 550 Rambler Ln
- 560 Rambler Ln
- 176 Indian Tree Dr
- 540 Rambler Ln
- 570 Rambler Ln
- 160 Indian Tree Dr
- 167 Indian Tree Dr
- 212 Blackhawk Rd
- 171 Indian Tree Dr
- 580 Rambler Ln
- 145 Indian Tree Dr
- 178 Indian Tree Dr
- 175 Indian Tree Dr
- 177 Indian Tree Dr
- 158 Indian Tree Dr
- 600 Rambler Ln