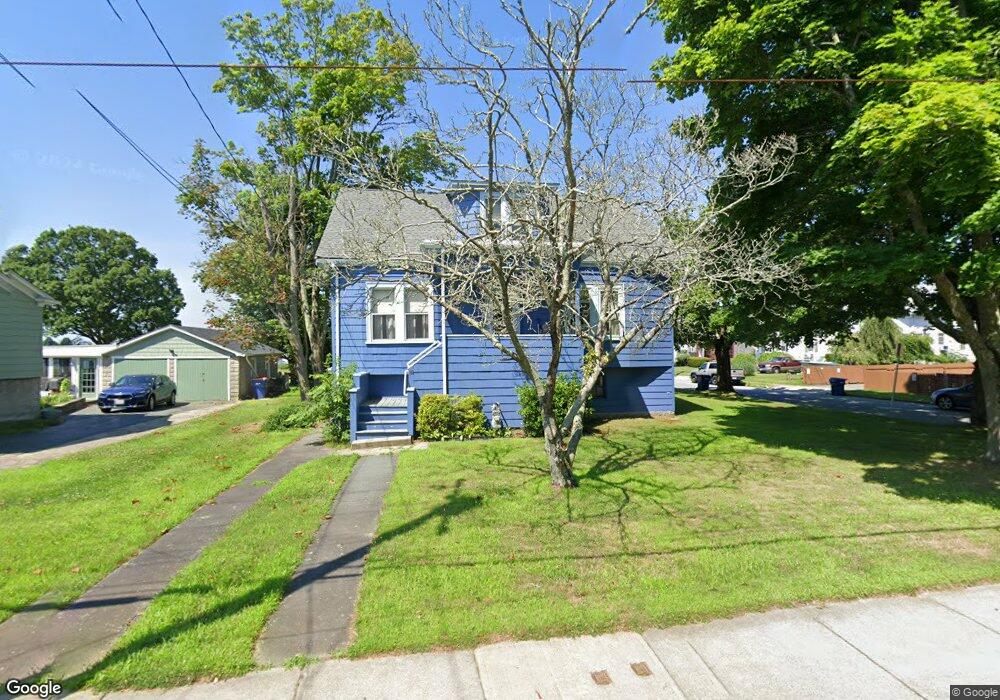
168 Main St Fairhaven, MA 02719
Oxford NeighborhoodEstimated Value: $472,166 - $519,000
4
Beds
2
Baths
1,904
Sq Ft
$261/Sq Ft
Est. Value
About This Home
This home is located at 168 Main St, Fairhaven, MA 02719 and is currently estimated at $496,542, approximately $260 per square foot. 168 Main St is a home located in Bristol County with nearby schools including Fairhaven High School, City On A Hill Charter Public School New Bedford, and St. Joseph School.
Ownership History
Date
Name
Owned For
Owner Type
Purchase Details
Closed on
Dec 31, 2009
Sold by
Letton Curtis A and Letton Lisa P
Bought by
Letton Curtis A
Current Estimated Value
Home Financials for this Owner
Home Financials are based on the most recent Mortgage that was taken out on this home.
Original Mortgage
$156,500
Interest Rate
4.85%
Mortgage Type
Purchase Money Mortgage
Create a Home Valuation Report for This Property
The Home Valuation Report is an in-depth analysis detailing your home's value as well as a comparison with similar homes in the area
Home Values in the Area
Average Home Value in this Area
Purchase History
| Date | Buyer | Sale Price | Title Company |
|---|---|---|---|
| Letton Curtis A | -- | -- |
Source: Public Records
Mortgage History
| Date | Status | Borrower | Loan Amount |
|---|---|---|---|
| Open | Letton Curtis A | $167,200 | |
| Closed | Letton Curtis A | $156,500 | |
| Previous Owner | Letton Curtis A | $90,048 |
Source: Public Records
Tax History
| Year | Tax Paid | Tax Assessment Tax Assessment Total Assessment is a certain percentage of the fair market value that is determined by local assessors to be the total taxable value of land and additions on the property. | Land | Improvement |
|---|---|---|---|---|
| 2025 | $34 | $360,500 | $180,400 | $180,100 |
| 2024 | $3,242 | $351,300 | $180,400 | $170,900 |
| 2023 | $3,242 | $325,800 | $167,200 | $158,600 |
| 2022 | $3,183 | $311,400 | $159,300 | $152,100 |
| 2021 | $3,005 | $266,200 | $144,800 | $121,400 |
| 2020 | $2,848 | $257,500 | $138,300 | $119,200 |
| 2019 | $2,749 | $235,600 | $125,900 | $109,700 |
| 2018 | $2,648 | $223,400 | $119,800 | $103,600 |
| 2017 | $2,602 | $216,100 | $119,800 | $96,300 |
| 2016 | $2,530 | $207,700 | $119,800 | $87,900 |
| 2015 | $2,500 | $205,800 | $119,800 | $86,000 |
Source: Public Records
Map
Nearby Homes
- 24 Academy Ave
- 138 Main St Unit 13
- 67 Bridge St
- 16 Ash St
- 15 School St
- 39 Christian St
- 8 Washington St
- 0 Nulands Neck Unit 73286360
- 442 Dana Farms
- 77 Adams St
- 58 Washington St
- 145 Pleasant St
- 24 Middle St
- 14 Sycamore St
- 313 Main St
- 253 Adams St
- 10 Livesey Pkwy
- 71 Sycamore St
- 181 Washington St
- 17 Campbell St
Your Personal Tour Guide
Ask me questions while you tour the home.