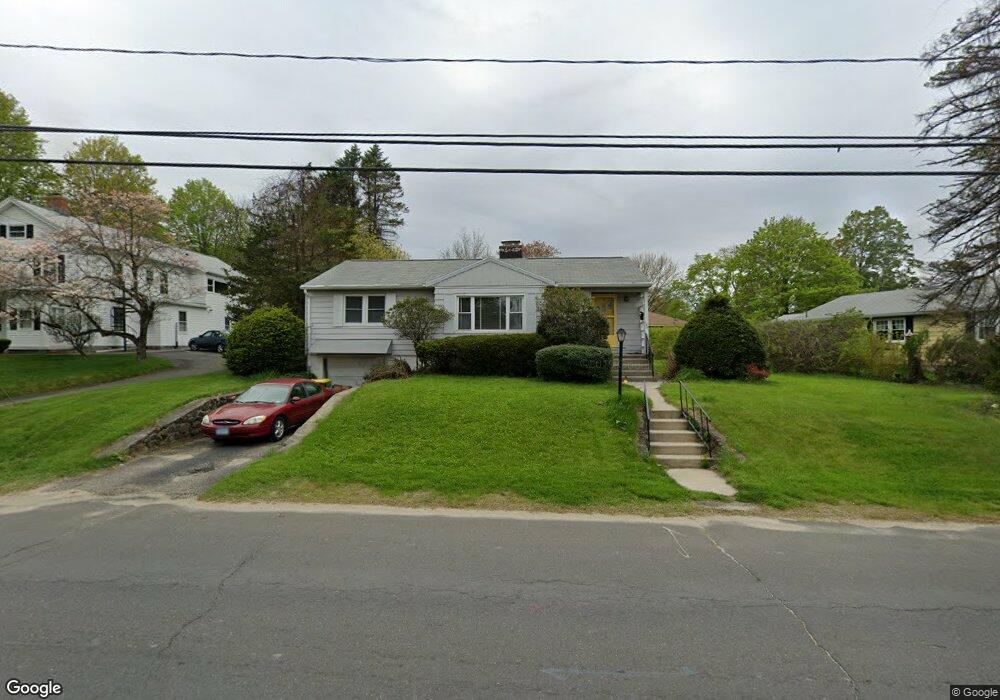
168 Peach Orchard Rd Waterbury, CT 06706
South End District NeighborhoodEstimated Value: $269,000 - $332,000
2
Beds
1
Bath
1,097
Sq Ft
$271/Sq Ft
Est. Value
About This Home
This home is located at 168 Peach Orchard Rd, Waterbury, CT 06706 and is currently estimated at $296,985, approximately $270 per square foot. 168 Peach Orchard Rd is a home located in New Haven County with nearby schools including Wendell L. Cross Elementary School, Michael F. Wallace Middle School, and Crosby High School.
Ownership History
Date
Name
Owned For
Owner Type
Purchase Details
Closed on
Oct 18, 1996
Sold by
Nilan Mary Est and Mcgill-Membrino
Bought by
Griffin Gary J
Current Estimated Value
Home Financials for this Owner
Home Financials are based on the most recent Mortgage that was taken out on this home.
Original Mortgage
$40,000
Outstanding Balance
$3,482
Interest Rate
7.5%
Mortgage Type
Purchase Money Mortgage
Estimated Equity
$293,503
Create a Home Valuation Report for This Property
The Home Valuation Report is an in-depth analysis detailing your home's value as well as a comparison with similar homes in the area
Home Values in the Area
Average Home Value in this Area
Purchase History
| Date | Buyer | Sale Price | Title Company |
|---|---|---|---|
| Griffin Gary J | $65,000 | -- |
Source: Public Records
Mortgage History
| Date | Status | Borrower | Loan Amount |
|---|---|---|---|
| Open | Griffin Gary J | $40,000 |
Source: Public Records
Tax History Compared to Growth
Tax History
| Year | Tax Paid | Tax Assessment Tax Assessment Total Assessment is a certain percentage of the fair market value that is determined by local assessors to be the total taxable value of land and additions on the property. | Land | Improvement |
|---|---|---|---|---|
| 2025 | $5,431 | $120,750 | $22,890 | $97,860 |
| 2024 | $5,970 | $120,750 | $22,890 | $97,860 |
| 2023 | $6,543 | $120,750 | $22,890 | $97,860 |
| 2022 | $4,270 | $70,920 | $22,900 | $48,020 |
| 2021 | $4,270 | $70,920 | $22,900 | $48,020 |
| 2020 | $4,270 | $70,920 | $22,900 | $48,020 |
| 2019 | $4,270 | $70,920 | $22,900 | $48,020 |
| 2018 | $4,270 | $70,920 | $22,900 | $48,020 |
| 2017 | $4,518 | $75,030 | $22,900 | $52,130 |
| 2016 | $4,518 | $75,030 | $22,900 | $52,130 |
| 2015 | $4,368 | $75,030 | $22,900 | $52,130 |
| 2014 | $4,368 | $75,030 | $22,900 | $52,130 |
Source: Public Records
Map
Nearby Homes
- 178 Peach Orchard Rd
- 89 Rockledge Dr
- 60 Gayfield Rd
- 44 Shadybrook Ln
- 147 Sprucedale Dr
- 185 Eastside Blvd
- 51 Clover St
- 562 Piedmont St
- 70 Glenrock Rd
- 439 Piedmont St
- 335 Raymond St
- 463 Pearl Lake Rd
- 0372 Floyd St
- 41L Floyd St
- 0039 Floyd St
- 140 Edgewood Ave
- 35 Mountain Village Rd Unit 30
- 00 Milton Ave
- 4 Florence Dr
- 65 Clark Hill Rd
- 178 Peach Orchard Rd Unit 2R
- 175 Peach Orchard Rd
- 163 Peach Orchard Rd
- 11 Skyline Dr
- 157 Peach Orchard Rd
- 25 Skyline Dr
- 10 Skyline Dr
- 190 Peach Orchard Rd
- 187 Peach Orchard Rd
- 22 Skyline Dr
- 247 E Mountain Rd
- 39 Skyline Dr
- 191 Peach Orchard Rd
- 240 E Mountain Rd
- 34 Skyline Dr
- 200 Peach Orchard Rd
- 140 Peach Orchard Rd
- 199 Peach Orchard Rd
- 232 E Mountain Rd
- 44 Skyline Dr