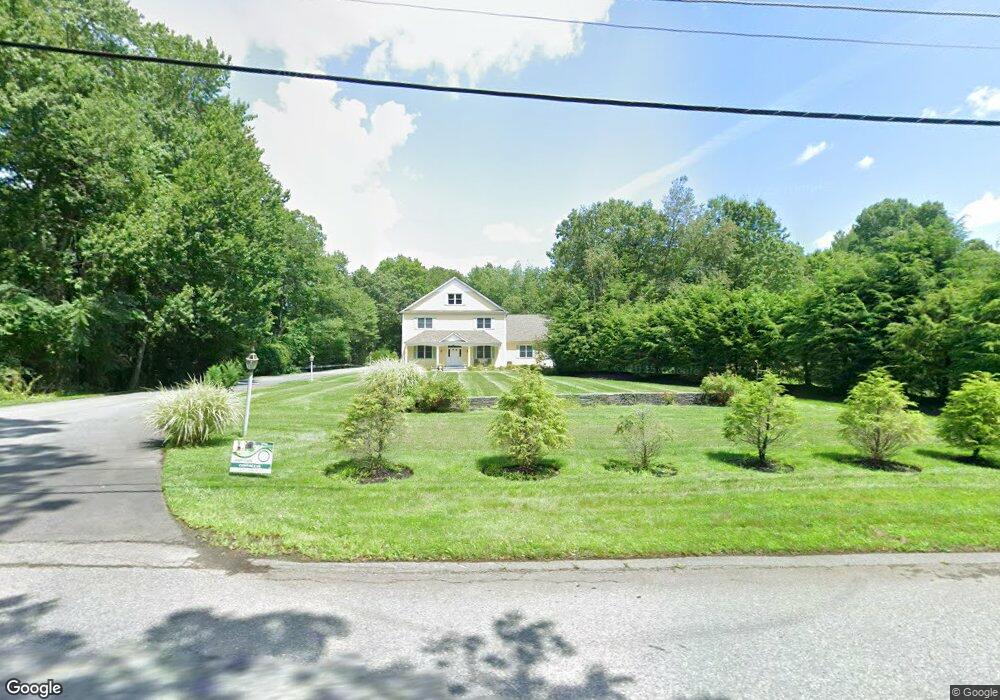
168 Proctor Rd Unit 1 Chelmsford, MA 01824
Old Stage Estates NeighborhoodEstimated Value: $1,083,000 - $1,288,000
2
Beds
1
Bath
2,200
Sq Ft
$534/Sq Ft
Est. Value
About This Home
This home is located at 168 Proctor Rd Unit 1, Chelmsford, MA 01824 and is currently estimated at $1,173,904, approximately $533 per square foot. 168 Proctor Rd Unit 1 is a home located in Middlesex County with nearby schools including South Row Elementary School, McCarthy Middle School, and Knowledge Beginnings South.
Ownership History
Date
Name
Owned For
Owner Type
Purchase Details
Closed on
Oct 20, 2016
Sold by
Peal Ruth E
Bought by
Martys Rt and Peal
Current Estimated Value
Purchase Details
Closed on
Aug 16, 2016
Sold by
Tbo Rt and Thibault
Bought by
Mass Real Estate Llc
Purchase Details
Closed on
Oct 13, 2000
Sold by
Ostrowski Michael Est and High
Bought by
Tbo Rt and Thibault
Create a Home Valuation Report for This Property
The Home Valuation Report is an in-depth analysis detailing your home's value as well as a comparison with similar homes in the area
Home Values in the Area
Average Home Value in this Area
Purchase History
| Date | Buyer | Sale Price | Title Company |
|---|---|---|---|
| Martys Rt | -- | -- | |
| Mass Real Estate Llc | $325,000 | -- | |
| Tbo Rt | $150,000 | -- |
Source: Public Records
Tax History Compared to Growth
Tax History
| Year | Tax Paid | Tax Assessment Tax Assessment Total Assessment is a certain percentage of the fair market value that is determined by local assessors to be the total taxable value of land and additions on the property. | Land | Improvement |
|---|---|---|---|---|
| 2025 | $16,173 | $1,163,500 | $341,400 | $822,100 |
| 2024 | $15,885 | $1,166,300 | $341,400 | $824,900 |
| 2023 | $14,327 | $997,000 | $347,800 | $649,200 |
| 2022 | $14,366 | $911,000 | $302,300 | $608,700 |
| 2021 | $13,236 | $840,900 | $277,200 | $563,700 |
| 2020 | $13,647 | $829,600 | $245,800 | $583,800 |
| 2019 | $13,018 | $796,200 | $254,000 | $542,200 |
| 2018 | $13,107 | $729,800 | $216,700 | $513,100 |
| 2017 | $13,992 | $780,800 | $203,000 | $577,800 |
| 2016 | $11,907 | $660,400 | $193,800 | $466,600 |
| 2015 | $11,891 | $635,900 | $176,000 | $459,900 |
| 2014 | $11,553 | $608,700 | $169,500 | $439,200 |
Source: Public Records
Map
Nearby Homes
- 6 Sierra Dr
- 12 Martin St
- 9 Donna Rd
- 10 Parlee Rd
- 5 Carriage Dr
- 1056 Curve St
- 81 Bartlett St
- 20 4th Ln
- 75 Garrison Rd
- 209 New Yorker Ave
- 8 Kay's Walk Unit 13
- 14 Kay's Walk
- 6 Kay's Walk Unit 6
- 6 Kay's Walk
- 2 Kay's Walk Unit 18
- 4 Kay's Walk Unit 15
- 3 Kay's Walk
- 15 Kay's Walk
- 1 Kay's Walk Unit 1
- 1 Kay's Walk