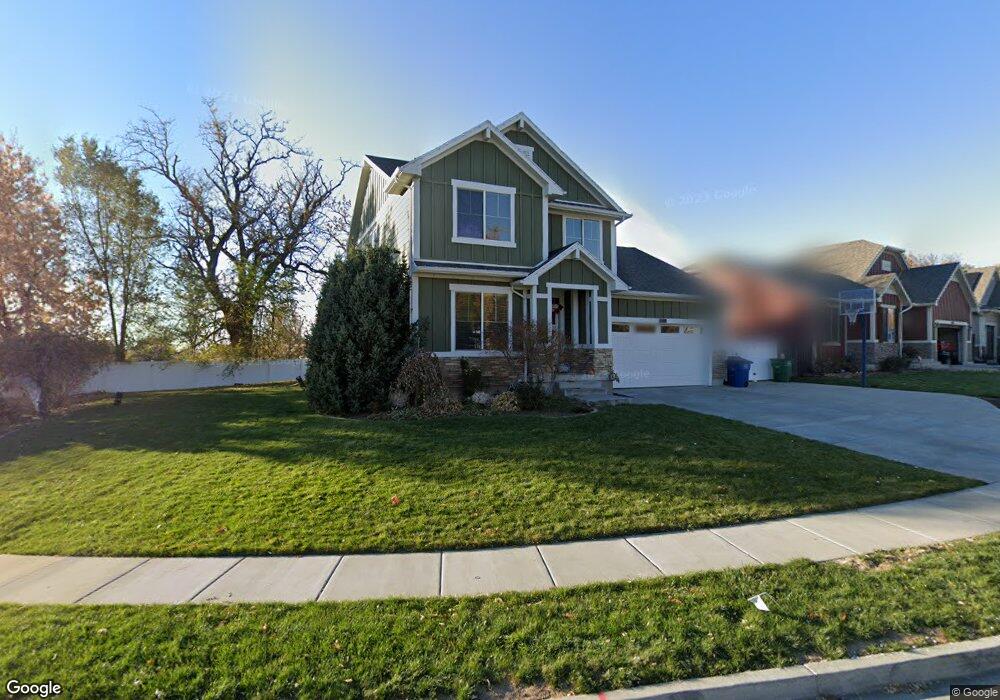
168 S Gailey Ln Kaysville, UT 84037
Estimated Value: $481,000 - $679,000
3
Beds
3
Baths
2,025
Sq Ft
$289/Sq Ft
Est. Value
About This Home
This home is located at 168 S Gailey Ln, Kaysville, UT 84037 and is currently estimated at $585,022, approximately $288 per square foot. 168 S Gailey Ln is a home with nearby schools including Columbia Elementary School, Kaysville Junior High School, and Davis High School.
Ownership History
Date
Name
Owned For
Owner Type
Purchase Details
Closed on
Mar 14, 2012
Sold by
Gross Garrett A and Gross Leah A
Bought by
Gross Garrett A and Hunt Leah A
Current Estimated Value
Home Financials for this Owner
Home Financials are based on the most recent Mortgage that was taken out on this home.
Original Mortgage
$201,000
Outstanding Balance
$137,809
Interest Rate
3.83%
Mortgage Type
New Conventional
Estimated Equity
$447,213
Purchase Details
Closed on
Mar 24, 2011
Sold by
Brighton Homes Utah Llc
Bought by
Gross Garrett A and Gross Leah A
Home Financials for this Owner
Home Financials are based on the most recent Mortgage that was taken out on this home.
Original Mortgage
$199,400
Interest Rate
5.02%
Mortgage Type
New Conventional
Purchase Details
Closed on
Nov 10, 2010
Sold by
Harold J Gailey Family Limited Partnersh
Bought by
Brighton Homes Utah Llc
Create a Home Valuation Report for This Property
The Home Valuation Report is an in-depth analysis detailing your home's value as well as a comparison with similar homes in the area
Home Values in the Area
Average Home Value in this Area
Purchase History
| Date | Buyer | Sale Price | Title Company |
|---|---|---|---|
| Gross Garrett A | -- | Hickman Land Title C | |
| Gross Garrett A | -- | First American Title | |
| Brighton Homes Utah Llc | -- | Bonneville Superior Title C |
Source: Public Records
Mortgage History
| Date | Status | Borrower | Loan Amount |
|---|---|---|---|
| Open | Gross Garrett A | $201,000 | |
| Closed | Gross Garrett A | $199,400 |
Source: Public Records
Tax History Compared to Growth
Tax History
| Year | Tax Paid | Tax Assessment Tax Assessment Total Assessment is a certain percentage of the fair market value that is determined by local assessors to be the total taxable value of land and additions on the property. | Land | Improvement |
|---|---|---|---|---|
| 2024 | $2,895 | $305,250 | $157,511 | $147,739 |
| 2023 | $2,978 | $556,000 | $275,026 | $280,974 |
| 2022 | $2,982 | $312,400 | $129,502 | $182,898 |
| 2021 | $3,063 | $481,000 | $180,447 | $300,553 |
| 2020 | $2,858 | $437,000 | $129,935 | $307,065 |
| 2019 | $2,757 | $414,000 | $107,828 | $306,172 |
| 2018 | $2,552 | $382,000 | $98,026 | $283,974 |
| 2016 | $2,335 | $183,700 | $32,831 | $150,869 |
| 2015 | $2,442 | $182,435 | $32,831 | $149,604 |
| 2014 | $2,584 | $196,532 | $32,831 | $163,701 |
| 2013 | -- | $175,680 | $40,988 | $134,692 |
Source: Public Records
Map
Nearby Homes
- 203 W 350 S
- 203 S Larkin Ln
- 32 Belmore Dr
- 87 E 100 S
- 172 W 400 S
- 300 S Larkin Ln
- 80 E Center St
- 337 W 350 S
- 71 W 450 S
- 384 Christine Way
- 558 S 50 E
- 75 S Grandison Ct E Unit 69-R
- 86 S Grandison Ct E Unit 79-R
- 127 S Rock Loft Ridge Dr Unit 57-R
- 159 S Rock Loft Ridge Dr Unit 59-R
- 1346 W Blackbird Ln Unit 3
- 209 N Rock Loft Ridge E Unit 32-R
- 198 S Rock Loft Ridge Dr E Unit 6-R
- 246 N Rock Loft Ridge Dr Unit 36-R
- 167 S Grandison E Unit 74-R