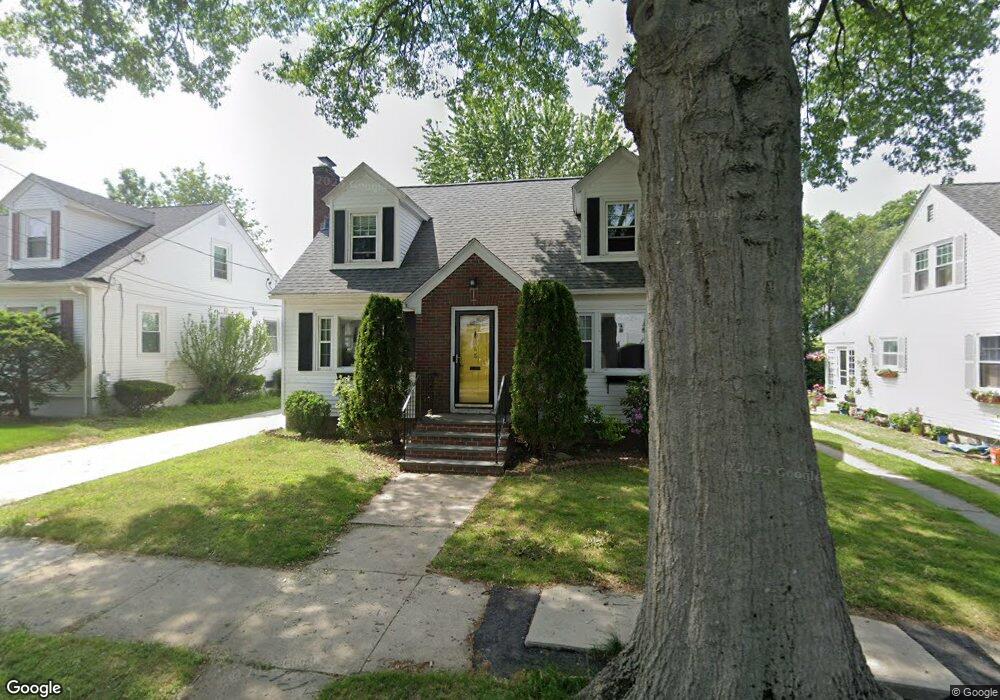
168 Sandringham Ave Providence, RI 02908
Elmhurst NeighborhoodEstimated Value: $416,183 - $646,000
4
Beds
2
Baths
1,476
Sq Ft
$331/Sq Ft
Est. Value
About This Home
This home is located at 168 Sandringham Ave, Providence, RI 02908 and is currently estimated at $488,296, approximately $330 per square foot. 168 Sandringham Ave is a home located in Providence County with nearby schools including St. Pius V Catholic School, St. Augustine School, and La Salle Academy.
Ownership History
Date
Name
Owned For
Owner Type
Purchase Details
Closed on
Sep 26, 2024
Sold by
Corso Richard P and Laliberte Donald M
Bought by
Corso Richard P and Laliberte Donald M
Current Estimated Value
Purchase Details
Closed on
Oct 14, 2011
Sold by
Freilino Paul Prewitt and Prewitt-Freilino Jennifer
Bought by
Laliberte Donald M and Corso Richard P
Home Financials for this Owner
Home Financials are based on the most recent Mortgage that was taken out on this home.
Original Mortgage
$180,500
Interest Rate
4.25%
Mortgage Type
Purchase Money Mortgage
Purchase Details
Closed on
Jul 3, 2007
Sold by
Green Terrence L
Bought by
Prewitt-Freilino Paul and Prewitt-Freilino Jennifer
Purchase Details
Closed on
May 14, 1999
Sold by
Fingliss Mary E
Bought by
Shadel William and Shadel Nicole
Purchase Details
Closed on
Feb 28, 1992
Sold by
Calise Archie
Bought by
Fingliss Mary E
Create a Home Valuation Report for This Property
The Home Valuation Report is an in-depth analysis detailing your home's value as well as a comparison with similar homes in the area
Home Values in the Area
Average Home Value in this Area
Purchase History
| Date | Buyer | Sale Price | Title Company |
|---|---|---|---|
| Corso Richard P | -- | None Available | |
| Corso Richard P | -- | None Available | |
| Laliberte Donald M | $190,000 | -- | |
| Prewitt-Freilino Paul | $239,500 | -- | |
| Shadel William | $112,000 | -- | |
| Fingliss Mary E | $111,000 | -- | |
| Laliberte Donald M | $190,000 | -- | |
| Prewitt-Freilino Paul | $239,500 | -- | |
| Shadel William | $112,000 | -- | |
| Fingliss Mary E | $111,000 | -- |
Source: Public Records
Mortgage History
| Date | Status | Borrower | Loan Amount |
|---|---|---|---|
| Previous Owner | Fingliss Mary E | $180,500 |
Source: Public Records
Tax History
| Year | Tax Paid | Tax Assessment Tax Assessment Total Assessment is a certain percentage of the fair market value that is determined by local assessors to be the total taxable value of land and additions on the property. | Land | Improvement |
|---|---|---|---|---|
| 2025 | $3,336 | $397,200 | $161,000 | $236,200 |
| 2024 | $5,745 | $313,100 | $104,600 | $208,500 |
| 2023 | $5,745 | $313,100 | $104,600 | $208,500 |
| 2022 | $3,065 | $313,100 | $104,600 | $208,500 |
| 2021 | $3,292 | $223,400 | $81,500 | $141,900 |
| 2020 | $5,487 | $223,400 | $81,500 | $141,900 |
| 2019 | $5,487 | $223,400 | $81,500 | $141,900 |
| 2018 | $5,705 | $178,500 | $65,500 | $113,000 |
| 2017 | $5,705 | $178,500 | $65,500 | $113,000 |
| 2016 | $5,705 | $178,500 | $65,500 | $113,000 |
| 2015 | $5,998 | $181,200 | $65,500 | $115,700 |
| 2014 | $6,116 | $181,200 | $65,500 | $115,700 |
| 2013 | $6,116 | $181,200 | $65,500 | $115,700 |
Source: Public Records
Map
Nearby Homes
- 354 Jastram St
- 39 Hillview Ave
- 797 Academy Ave
- 507 Sharon St
- 68 Enfield Ave
- 84 Enfield Ave
- 556 Admiral St
- 0 Wainwright St
- 835 River Ave
- 160 Cumberland St
- 197 Enfield Ave
- 36 Hereford St
- 73 Wainwright St
- 179 Devonshire St
- 25 Hymer St
- 876 Douglas Ave
- 115 Hazael St
- 841 Smith St
- 1189 Smith St
- 873 Douglas Ave
- 172 Sandringham Ave
- 164 Sandringham Ave
- 57 Stonelaw Ave
- 160 Sandringham Ave
- 160 Sandringham Ave
- 61 Stonelaw Ave
- 53 Stonelaw Ave
- 176 Sandringham Ave
- 165 Sandringham Ave
- 65 Stonelaw Ave
- 49 Stonelaw Ave
- 161 Sandringham Ave
- 169 Sandringham Ave
- 156 Sandringham Ave
- 180 Sandringham Ave
- 157 Sandringham Ave
- 45 Stonelaw Ave
- 69 Stonelaw Ave
- 157 Sandgringhham Ave
- 152 Sandringham Ave
Your Personal Tour Guide
Ask me questions while you tour the home.