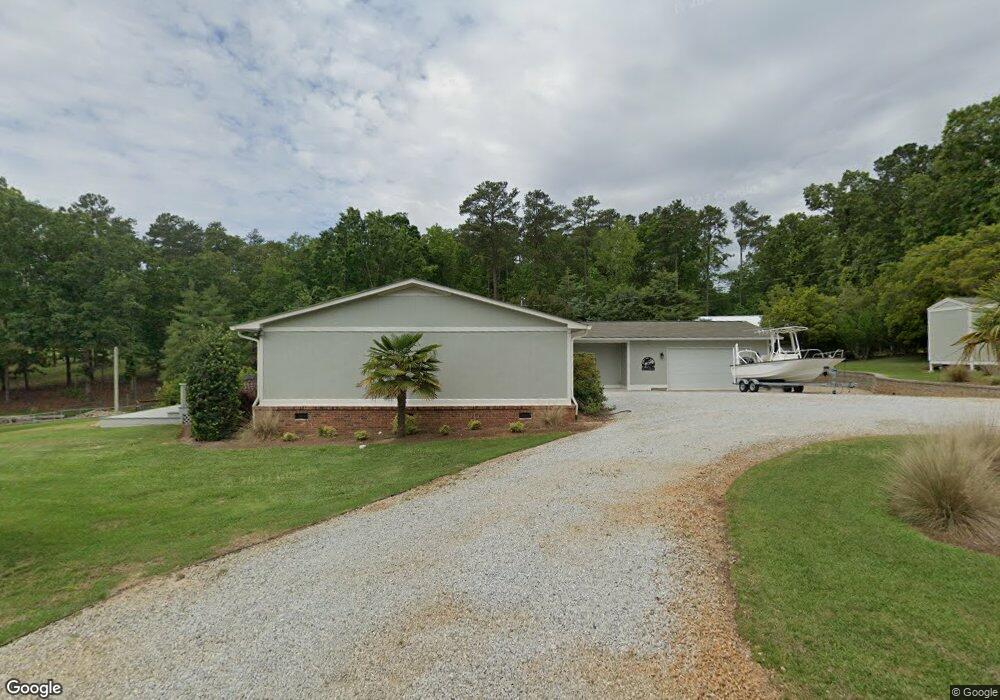
168 Stoneridge Rd Chapin, SC 29036
Estimated Value: $573,000 - $757,000
3
Beds
2
Baths
1,638
Sq Ft
$403/Sq Ft
Est. Value
About This Home
This home is located at 168 Stoneridge Rd, Chapin, SC 29036 and is currently estimated at $659,753, approximately $402 per square foot. 168 Stoneridge Rd is a home located in Lexington County with nearby schools including Lake Murray Elementary School, Chapin Intermediate, and Chapin High School.
Ownership History
Date
Name
Owned For
Owner Type
Purchase Details
Closed on
Apr 3, 2017
Sold by
Royson Richard D and Royson Christine L
Bought by
Cishek George B
Current Estimated Value
Purchase Details
Closed on
Jun 25, 2009
Sold by
Greene Darren M and Greene Anne C
Bought by
Royson Richard D and Royson Christine L
Home Financials for this Owner
Home Financials are based on the most recent Mortgage that was taken out on this home.
Original Mortgage
$310,800
Interest Rate
4.88%
Mortgage Type
Future Advance Clause Open End Mortgage
Purchase Details
Closed on
May 12, 2005
Sold by
Williamson Martha B
Bought by
Greene Darren M and Greene Anne C
Home Financials for this Owner
Home Financials are based on the most recent Mortgage that was taken out on this home.
Original Mortgage
$35,850
Interest Rate
5.8%
Mortgage Type
Stand Alone Second
Create a Home Valuation Report for This Property
The Home Valuation Report is an in-depth analysis detailing your home's value as well as a comparison with similar homes in the area
Home Values in the Area
Average Home Value in this Area
Purchase History
| Date | Buyer | Sale Price | Title Company |
|---|---|---|---|
| Cishek George B | $357 | None Available | |
| Royson Richard D | $327,250 | -- | |
| Greene Darren M | $239,000 | -- |
Source: Public Records
Mortgage History
| Date | Status | Borrower | Loan Amount |
|---|---|---|---|
| Previous Owner | Royson Richard D | $310,800 | |
| Previous Owner | Greene Darren M | $35,850 | |
| Previous Owner | Greene Darren M | $191,200 |
Source: Public Records
Tax History Compared to Growth
Tax History
| Year | Tax Paid | Tax Assessment Tax Assessment Total Assessment is a certain percentage of the fair market value that is determined by local assessors to be the total taxable value of land and additions on the property. | Land | Improvement |
|---|---|---|---|---|
| 2024 | $2,030 | $15,828 | $9,000 | $6,828 |
| 2023 | $2,030 | $15,828 | $9,000 | $6,828 |
| 2022 | $2,063 | $15,828 | $9,000 | $6,828 |
| 2020 | $2,165 | $15,828 | $9,000 | $6,828 |
| 2019 | $2,033 | $14,794 | $5,824 | $8,970 |
| 2018 | $2,141 | $14,794 | $5,824 | $8,970 |
| 2017 | $1,502 | $10,645 | $5,824 | $4,821 |
| 2016 | $1,540 | $10,645 | $5,824 | $4,821 |
| 2014 | $1,886 | $13,089 | $7,280 | $5,809 |
| 2013 | -- | $13,090 | $7,280 | $5,810 |
Source: Public Records
Map
Nearby Homes
- 417 Brookridge Dr
- 1118 Marble Arch Ct
- 625 Mallard Dr
- 2347 Hadley Crossing
- 2351 Hadley Crossing
- 2355 Hadley Crossing
- 3010 Chilmark Rd
- 2340 Hadley Crossing
- 2316 Hadley Crossing
- 2344 Hadley Crossing
- 2348 Hadley Crossing
- 454 Brookridge Dr
- 1081 Point View Rd
- 180 Tanners Mill Rd
- 516 Mitscher Way
- 414 Pine Log Run
- 533 Mitscher Way
- 143 Doolittle Dr
- 622 Autumn Shiloh Dr
- 515 Pine Log Run
- 173 Stoneridge Rd
- 164 Stoneridge Rd
- 169 Stoneridge Rd
- 165 Stoneridge Rd
- 161 Stoneridge Rd
- 157 Stoneridge Rd
- 154 Stoneridge Rd
- 153 Stoneridge Rd
- 150 Stoneridge Rd
- 151 Stoneridge Rd
- 0 Stoneridge Rd Unit 241707
- 0 Stoneridge Rd Unit 251419
- 0 Stoneridge Rd Unit 267504
- 0 Stoneridge Rd Unit 537033
- 0 Stoneridge Rd Unit 512126
- 0 Stoneridge Rd Unit 495586
- 149 Stoneridge Rd
- 147 Stoneridge Rd
- S/O Stoneridge Rd
- 128 Bri Lor Ct