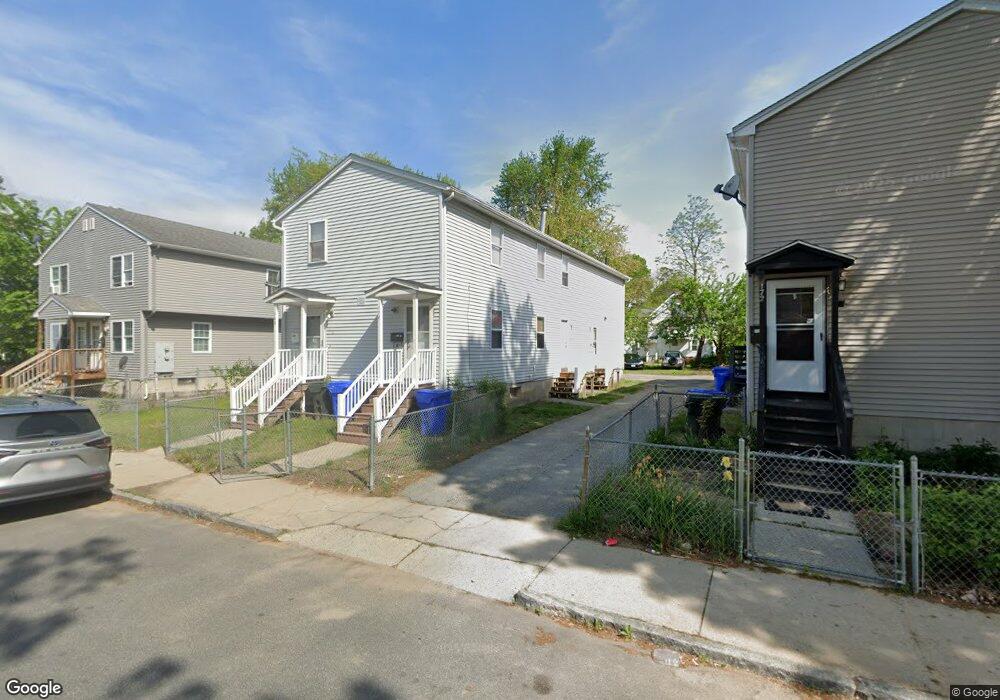
168 Tyler St Unit 170 Springfield, MA 01109
Old Hill NeighborhoodEstimated Value: $253,079 - $392,000
6
Beds
2
Baths
2,480
Sq Ft
$122/Sq Ft
Est. Value
About This Home
This home is located at 168 Tyler St Unit 170, Springfield, MA 01109 and is currently estimated at $303,520, approximately $122 per square foot. 168 Tyler St Unit 170 is a home located in Hampden County with nearby schools including William N. DeBerry Elementary School, M Marcus Kiley Middle, and High School Of Commerce.
Ownership History
Date
Name
Owned For
Owner Type
Purchase Details
Closed on
Sep 26, 2003
Sold by
Hallerin Realty Lp and Burgess David A
Bought by
Gomez Randol E
Current Estimated Value
Home Financials for this Owner
Home Financials are based on the most recent Mortgage that was taken out on this home.
Original Mortgage
$103,500
Outstanding Balance
$48,564
Interest Rate
6.29%
Mortgage Type
Purchase Money Mortgage
Estimated Equity
$254,956
Purchase Details
Closed on
Mar 15, 1991
Sold by
Kelly Robert A
Bought by
Roy Ernest and Roy Jean
Create a Home Valuation Report for This Property
The Home Valuation Report is an in-depth analysis detailing your home's value as well as a comparison with similar homes in the area
Home Values in the Area
Average Home Value in this Area
Purchase History
| Date | Buyer | Sale Price | Title Company |
|---|---|---|---|
| Gomez Randol E | $115,000 | -- | |
| Roy Ernest | $210,000 | -- |
Source: Public Records
Mortgage History
| Date | Status | Borrower | Loan Amount |
|---|---|---|---|
| Open | Gomez Randol E | $103,500 |
Source: Public Records
Tax History Compared to Growth
Tax History
| Year | Tax Paid | Tax Assessment Tax Assessment Total Assessment is a certain percentage of the fair market value that is determined by local assessors to be the total taxable value of land and additions on the property. | Land | Improvement |
|---|---|---|---|---|
| 2025 | $3,211 | $204,800 | $25,500 | $179,300 |
| 2024 | $3,718 | $231,500 | $23,800 | $207,700 |
| 2023 | $2,840 | $165,600 | $22,700 | $142,900 |
| 2022 | $2,597 | $138,000 | $20,600 | $117,400 |
| 2021 | $2,667 | $141,100 | $18,700 | $122,400 |
| 2020 | $2,740 | $140,300 | $18,700 | $121,600 |
| 2019 | $2,106 | $107,000 | $18,700 | $88,300 |
| 2018 | $2,550 | $111,700 | $18,700 | $93,000 |
| 2017 | $2,550 | $129,700 | $15,000 | $114,700 |
| 2016 | $2,273 | $115,600 | $15,000 | $100,600 |
| 2015 | $2,272 | $115,500 | $15,000 | $100,500 |
Source: Public Records
Map
Nearby Homes
- 172 Tyler St Unit 174
- 172-174 Tyler St
- 164 Tyler St Unit 166
- 164-166 Tyler St Unit 1
- 164-166 Tyler St
- 180 Tyler St
- 162 Tyler St
- 182 Tyler St
- 163 Quincy St
- 171 Tyler St
- 156 Tyler St
- 175 Quincy St
- 159 Quincy St Unit 161
- 173 Tyler St
- 184 Tyler St Unit 186
- 154 Tyler St
- 183 Tyler St
- 151 Quincy St
- 149 Quincy St
- 151 Quincy St Unit 2