S
Landlord's Agent in 2025
Sprogis Neale Doherty Team
Sprogis & Neale Real Estate
(617) 262-1504
116 in this area
154 Total Sales


Estimated Value: $4,578,396 - $4,976,000
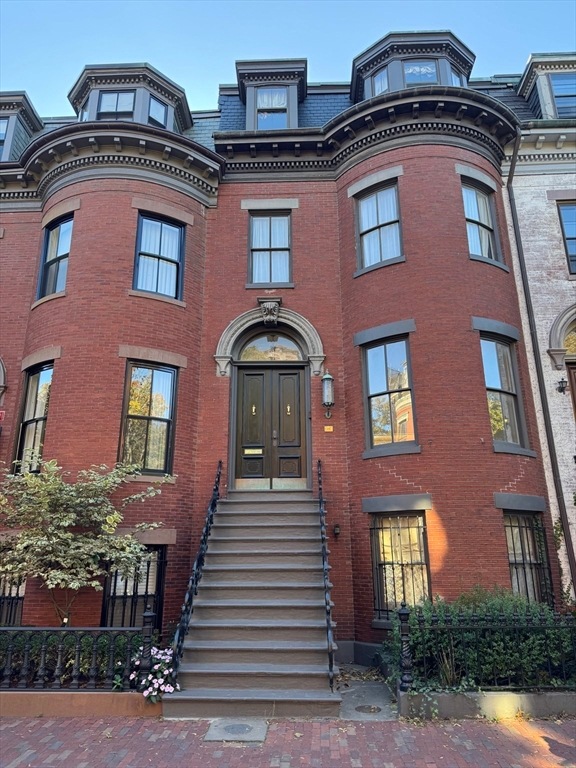
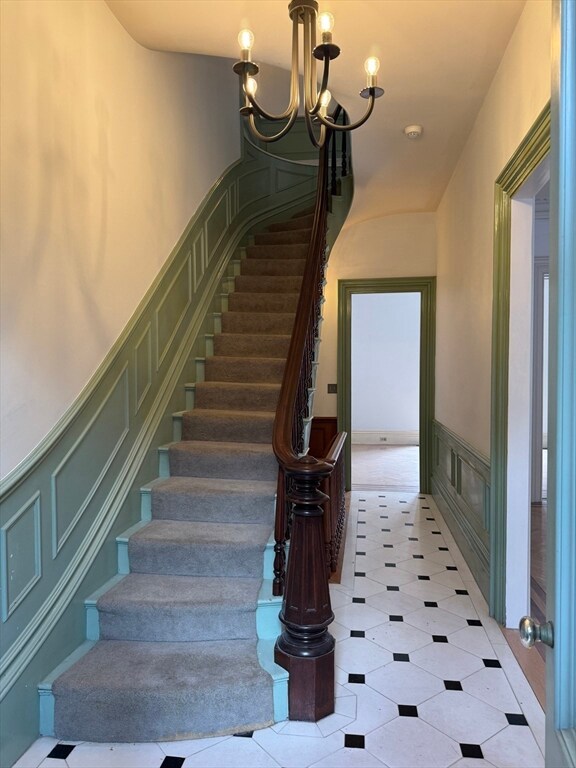
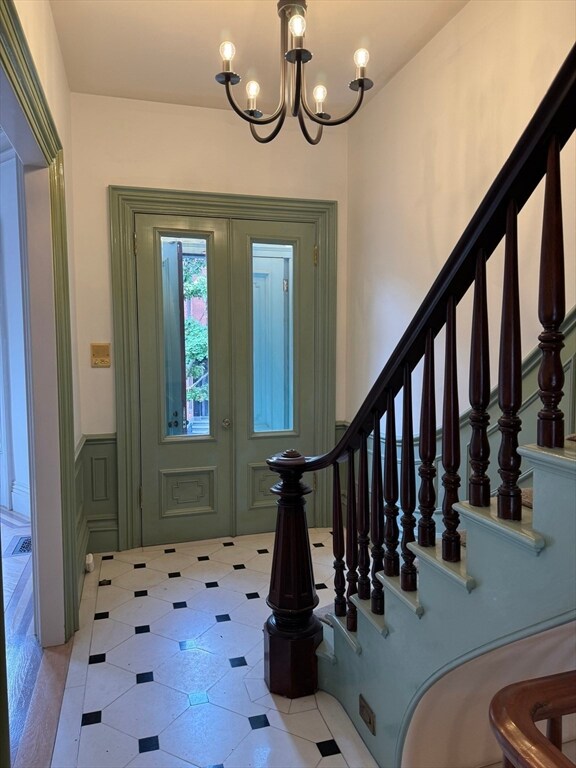
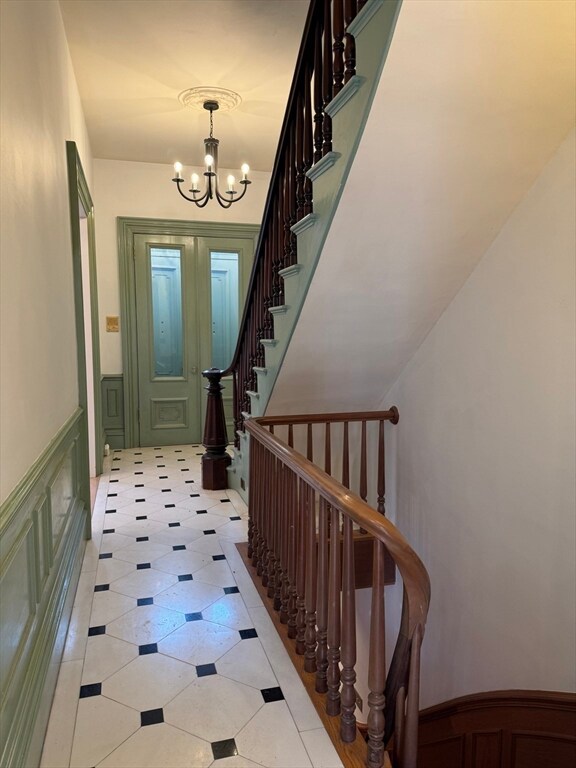
FEE PAID BY LANDLORD! Elegant single-family townhouse on one of Boston's most desirable streets! Overlooking lovely Hayes Park and just minutes from the best of the Back Bay and the South End, this classic home is a blend of historic details and contemporary amenities, with a dramatic two-story family/sunroom that opens out to a southwest-facing garden. The home is ideal for entertaining, or for working from home, with a library, dining room and living room in addition to the family room. The full-floor primary suite has beautiful views and an enormous walk-in closet. There are two full parking spaces directly accessible from the family room/kitchen level. The second and third bedrooms are large and bright. See the attached floor plans for more detail. Don't miss this opportunity to live in one of Boston's finest locations!
Last Agent to Rent the Property
Sprogis & Neale Real Estate Listed on: 10/12/2024
| Date | Event | Price | List to Sale | Price per Sq Ft | Prior Sale |
|---|---|---|---|---|---|
| 03/25/2025 03/25/25 | Rented | $9,000 | -9.8% | -- | |
| 02/25/2025 02/25/25 | Under Contract | -- | -- | -- | |
| 01/24/2025 01/24/25 | Price Changed | $9,975 | -23.3% | $2 / Sq Ft | |
| 10/12/2024 10/12/24 | For Rent | $13,000 | 0.0% | -- | |
| 08/29/2024 08/29/24 | Sold | $4,485,000 | -6.5% | $1,063 / Sq Ft | View Prior Sale |
| 07/01/2024 07/01/24 | Pending | -- | -- | -- | |
| 07/01/2024 07/01/24 | For Sale | $4,795,000 | +6.9% | $1,136 / Sq Ft | |
| 06/20/2024 06/20/24 | Off Market | $4,485,000 | -- | -- | |
| 06/16/2024 06/16/24 | For Sale | $4,795,000 | 0.0% | $1,136 / Sq Ft | |
| 06/04/2024 06/04/24 | Pending | -- | -- | -- | |
| 06/04/2024 06/04/24 | For Sale | $4,795,000 | -- | $1,136 / Sq Ft |
| Year | Tax Paid | Tax Assessment Tax Assessment Total Assessment is a certain percentage of the fair market value that is determined by local assessors to be the total taxable value of land and additions on the property. | Land | Improvement |
|---|---|---|---|---|
| 2025 | $48,756 | $4,210,400 | $1,696,200 | $2,514,200 |
| 2024 | $44,137 | $4,049,300 | $1,531,600 | $2,517,700 |
| 2023 | $41,819 | $3,893,800 | $1,472,800 | $2,421,000 |
| 2022 | $40,750 | $3,745,400 | $1,416,700 | $2,328,700 |
| 2021 | $37,701 | $3,533,400 | $1,336,500 | $2,196,900 |
| 2020 | $34,157 | $3,234,600 | $1,265,600 | $1,969,000 |
| 2019 | $33,108 | $3,141,200 | $1,043,600 | $2,097,600 |
| 2018 | $31,970 | $3,050,600 | $1,043,600 | $2,007,000 |
| 2017 | $30,754 | $2,904,100 | $1,043,600 | $1,860,500 |
| 2016 | $29,307 | $2,664,300 | $1,043,600 | $1,620,700 |
| 2015 | $29,792 | $2,460,100 | $561,900 | $1,898,200 |
| 2014 | $27,623 | $2,195,800 | $561,900 | $1,633,900 |
S
Landlord's Agent in 2025
Sprogis Neale Doherty Team
Sprogis & Neale Real Estate
(617) 262-1504
116 in this area
154 Total Sales
Y
Tenant's Agent in 2025
Youcef Ziad
Atlas Group, LLC
(781) 927-4377
1 in this area
17 Total Sales

Seller's Agent in 2024
Paul Whaley
Coldwell Banker Realty - Boston
(617) 460-4238
86 in this area
324 Total Sales
Source: MLS Property Information Network (MLS PIN)
MLS Number: 73301680
APN: CBOS-000000-000004-000458
Disclaimer: Certain information contained herein is derived from information provided by parties other than Homes.com. All information provided is deemed reliable, but is not guaranteed to be accurate and should be independently verified.
![]() The property listing data and information, or the Images, set forth herein were provided to MLS Property Information Network, Inc. from third party sources, including sellers, lessors and public records, and were compiled by MLS Property Information Network, Inc. The property listing data and information, and the Images, are for the personal, non-commercial use of consumers having a good faith interest in purchasing or leasing listed properties of the type displayed to them and may not be used for any purpose other than to identify prospective properties which such consumers may have a good faith interest in purchasing or leasing. MLS Property Information Network, Inc. and its subscribers disclaim any and all representations and warranties as to the accuracy of the property listing data and information, or as to the accuracy of any of the Images, set forth herein.
The property listing data and information, or the Images, set forth herein were provided to MLS Property Information Network, Inc. from third party sources, including sellers, lessors and public records, and were compiled by MLS Property Information Network, Inc. The property listing data and information, and the Images, are for the personal, non-commercial use of consumers having a good faith interest in purchasing or leasing listed properties of the type displayed to them and may not be used for any purpose other than to identify prospective properties which such consumers may have a good faith interest in purchasing or leasing. MLS Property Information Network, Inc. and its subscribers disclaim any and all representations and warranties as to the accuracy of the property listing data and information, or as to the accuracy of any of the Images, set forth herein.