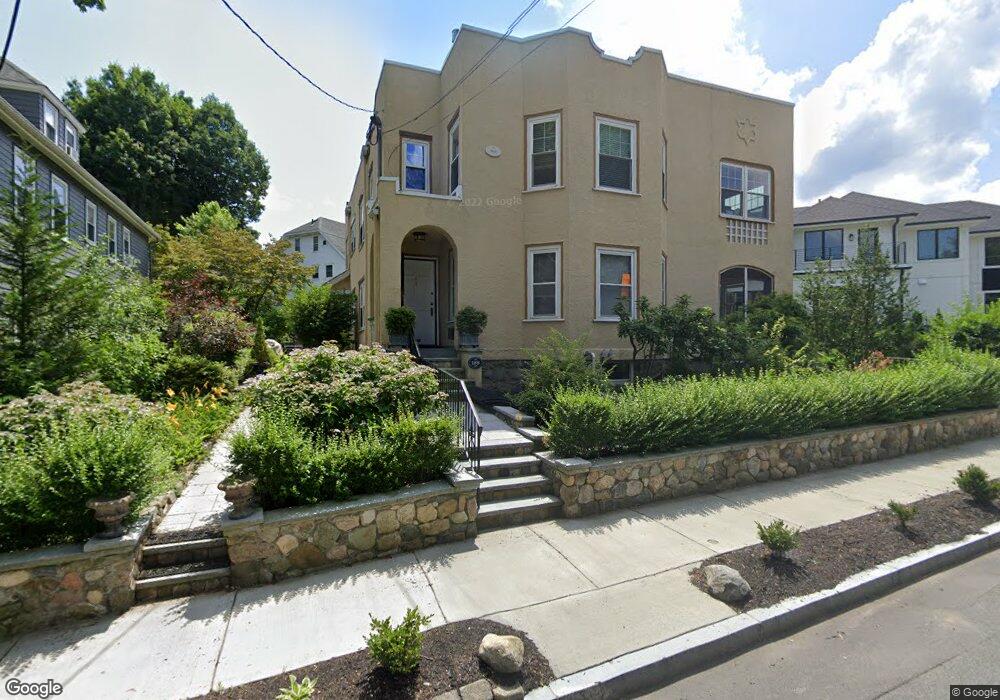
168 Warren St Unit 170 Newton Center, MA 02459
Newton Centre NeighborhoodEstimated Value: $1,830,486 - $2,553,000
6
Beds
3
Baths
3,192
Sq Ft
$652/Sq Ft
Est. Value
About This Home
This home is located at 168 Warren St Unit 170, Newton Center, MA 02459 and is currently estimated at $2,081,622, approximately $652 per square foot. 168 Warren St Unit 170 is a home located in Middlesex County with nearby schools including Mason Rice Elementary School, Bowen School, and Oak Hill Middle School.
Ownership History
Date
Name
Owned For
Owner Type
Purchase Details
Closed on
Nov 26, 2019
Sold by
Johnson and Surman Amy
Bought by
Surman Johnson and Surman Amy
Current Estimated Value
Purchase Details
Closed on
Aug 19, 2003
Sold by
Johnson-Surman Amy and Johnson Amy L
Bought by
Surman Amy Johnson and Surman Owen S
Home Financials for this Owner
Home Financials are based on the most recent Mortgage that was taken out on this home.
Original Mortgage
$175,000
Interest Rate
5.46%
Create a Home Valuation Report for This Property
The Home Valuation Report is an in-depth analysis detailing your home's value as well as a comparison with similar homes in the area
Home Values in the Area
Average Home Value in this Area
Purchase History
| Date | Buyer | Sale Price | Title Company |
|---|---|---|---|
| Surman Johnson | -- | None Available | |
| Surman Amy Johnson | -- | -- | |
| Surman Amy Johnson | -- | -- |
Source: Public Records
Mortgage History
| Date | Status | Borrower | Loan Amount |
|---|---|---|---|
| Previous Owner | Surman Amy Johnson | $495,000 | |
| Previous Owner | Surman Amy Johnson | $175,000 |
Source: Public Records
Tax History Compared to Growth
Tax History
| Year | Tax Paid | Tax Assessment Tax Assessment Total Assessment is a certain percentage of the fair market value that is determined by local assessors to be the total taxable value of land and additions on the property. | Land | Improvement |
|---|---|---|---|---|
| 2025 | $14,388 | $1,468,200 | $803,500 | $664,700 |
| 2024 | $13,912 | $1,425,400 | $780,100 | $645,300 |
| 2023 | $13,414 | $1,317,700 | $621,100 | $696,600 |
| 2022 | $12,648 | $1,202,300 | $575,100 | $627,200 |
| 2021 | $13,066 | $1,214,300 | $527,600 | $686,700 |
| 2020 | $12,677 | $1,214,300 | $527,600 | $686,700 |
| 2019 | $11,860 | $1,134,900 | $493,100 | $641,800 |
| 2018 | $11,821 | $1,092,500 | $464,200 | $628,300 |
| 2017 | $11,146 | $1,002,300 | $425,900 | $576,400 |
| 2016 | $10,464 | $919,500 | $390,700 | $528,800 |
| 2015 | $9,976 | $859,300 | $365,100 | $494,200 |
Source: Public Records
Map
Nearby Homes
- 173-175 Warren St
- 145 Warren St Unit 4
- 154 Langley Rd Unit 1
- 9 Ripley St Unit 1
- 20 Bartlett Terrace
- 9 The Ledges Rd
- 266 Langley Rd Unit 1
- 42 Bow Rd
- 20 Hamlet St
- 20 Hamlet St Unit 1
- 92 Grant Ave
- 44 Irving St
- 5 Halcyon Rd
- 21 Francis St Unit 21A
- 23 Francis St Unit 23-1
- 1004 Centre St
- Lot 3 Chapin Rd
- Lot 2 Chapin Rd
- Lots 2 & 3 Chapin Rd
- 42 Sunhill Ln
- 176 Warren St Unit 1
- 160 Warren St Unit 162
- 100 Langley Rd
- 112 Langley Rd
- 4 Warren Terrace
- 4 Warren Terrace Unit 2
- 4 Warren Terrace Unit 4
- 118 Langley Rd
- 118 Langley Rd Unit 2
- 118 Langley Rd Unit 1
- 173 Warren St
- 173 Warren St Unit 175
- 173 Warren St Unit 2
- 173 Warren St Unit 173
- 175 Warren St Unit PKG
- 175 Warren St
- 154 Warren St Unit 1
- 154 Warren St Unit 156
- 154 Warren St Unit 156
- 154 Warren St Unit 154