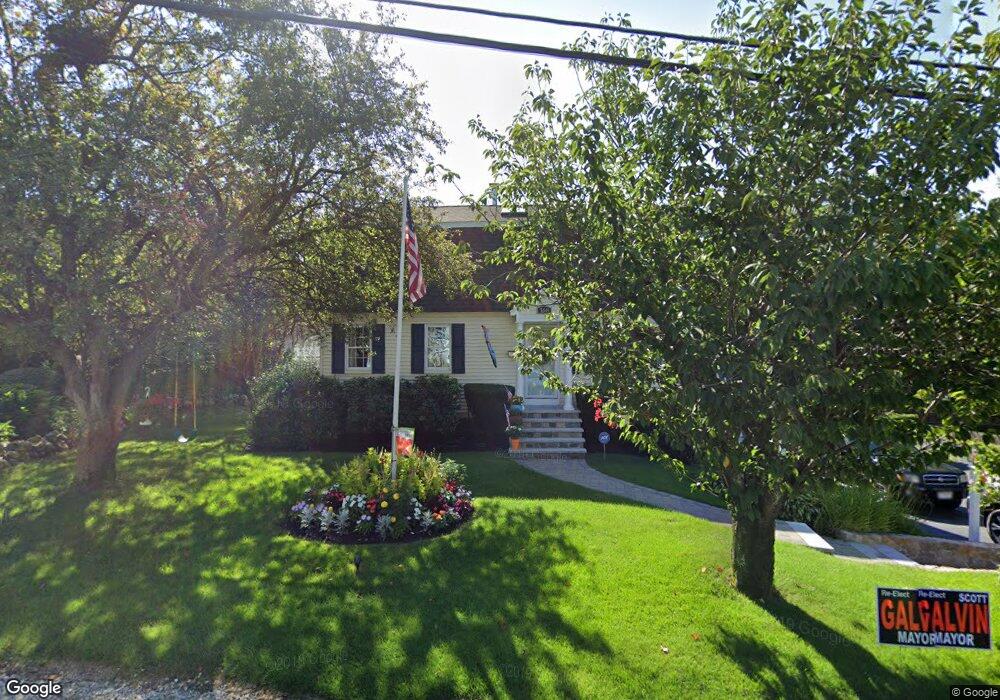
168 Washington Cir Unit R Woburn, MA 01801
Walnut Hill NeighborhoodEstimated Value: $859,647 - $1,608,000
4
Beds
3
Baths
1,196
Sq Ft
$895/Sq Ft
Est. Value
About This Home
This home is located at 168 Washington Cir Unit R, Woburn, MA 01801 and is currently estimated at $1,070,662, approximately $895 per square foot. 168 Washington Cir Unit R is a home located in Middlesex County with nearby schools including Goodyear Elementary School, John F. Kennedy Middle School, and Woburn High School.
Ownership History
Date
Name
Owned For
Owner Type
Purchase Details
Closed on
Apr 28, 2011
Sold by
Hammond 3Rd Robert L and Hammond Robert L
Bought by
Flaherty John and Flaherty Kathyn A
Current Estimated Value
Purchase Details
Closed on
Sep 21, 2004
Sold by
Baron David R and Baron Michelle L
Bought by
Hammond Robert L
Purchase Details
Closed on
Nov 2, 1998
Sold by
Severance Charles D and Severance Barbara M
Bought by
Baron David R and Baron Michelle L
Home Financials for this Owner
Home Financials are based on the most recent Mortgage that was taken out on this home.
Original Mortgage
$208,000
Interest Rate
6.68%
Mortgage Type
Purchase Money Mortgage
Create a Home Valuation Report for This Property
The Home Valuation Report is an in-depth analysis detailing your home's value as well as a comparison with similar homes in the area
Home Values in the Area
Average Home Value in this Area
Purchase History
| Date | Buyer | Sale Price | Title Company |
|---|---|---|---|
| Flaherty John | $350,000 | -- | |
| Flaherty John | $350,000 | -- | |
| Hammond Robert L | $450,000 | -- | |
| Hammond Robert L | $450,000 | -- | |
| Baron David R | $260,000 | -- |
Source: Public Records
Mortgage History
| Date | Status | Borrower | Loan Amount |
|---|---|---|---|
| Open | Baron David R | $290,616 | |
| Previous Owner | Baron David R | $62,000 | |
| Previous Owner | Baron David R | $208,000 |
Source: Public Records
Tax History Compared to Growth
Tax History
| Year | Tax Paid | Tax Assessment Tax Assessment Total Assessment is a certain percentage of the fair market value that is determined by local assessors to be the total taxable value of land and additions on the property. | Land | Improvement |
|---|---|---|---|---|
| 2025 | $6,133 | $718,200 | $339,600 | $378,600 |
| 2024 | $5,660 | $702,200 | $323,600 | $378,600 |
| 2023 | $5,161 | $593,200 | $294,200 | $299,000 |
| 2022 | $4,972 | $532,300 | $256,400 | $275,900 |
| 2021 | $4,755 | $509,600 | $244,400 | $265,200 |
| 2020 | $4,592 | $492,700 | $244,400 | $248,300 |
| 2019 | $4,358 | $458,700 | $233,000 | $225,700 |
| 2018 | $4,243 | $429,000 | $214,100 | $214,900 |
| 2017 | $4,080 | $410,500 | $204,200 | $206,300 |
| 2016 | $3,897 | $387,800 | $191,100 | $196,700 |
| 2015 | $3,754 | $369,100 | $178,900 | $190,200 |
| 2014 | $3,601 | $344,900 | $178,900 | $166,000 |
Source: Public Records
Map
Nearby Homes
- 18 Central St
- 18 Carmen Terrace
- 35 Grape St
- 3 Frank St
- 6 Stratton Dr Unit 404
- 6 Stratton Dr Unit 410
- 295 Salem St Unit 69
- 200 Ledgewood Dr Unit 505
- 100 Ledgewood Dr Unit 417
- 100 Ledgewood Dr Unit 618
- 405 William St
- 2 Archer Dr Unit 1
- 2 Mason Way Unit 6524
- 6 Mason Way Unit 6324
- 3 Laurel St
- 19 Mason Way Unit 75
- 10 Mason Way Unit 61
- 2 Stratton Dr Unit 1109
- 51 Vernon St
- 1 Boline Place
- 168 Washington Cir
- 4 Smith Ln
- 4 Smith Ln Unit 1
- 6 Nason Terrace
- 7 Floyd St
- 11 Floyd St
- 9 Nason Terrace
- 166 Washington Cir
- 170 Washington Cir
- 168R Washington Cir
- 2 Smith Ln
- 156 Washington Cir
- 5 Floyd St
- 162 Washington Cir Unit A
- 174 Washington Cir
- 15 Floyd St
- 3 Floyd St
- 120 Pine St
- 169 Washington Cir
- 169 Washington Cir Unit A