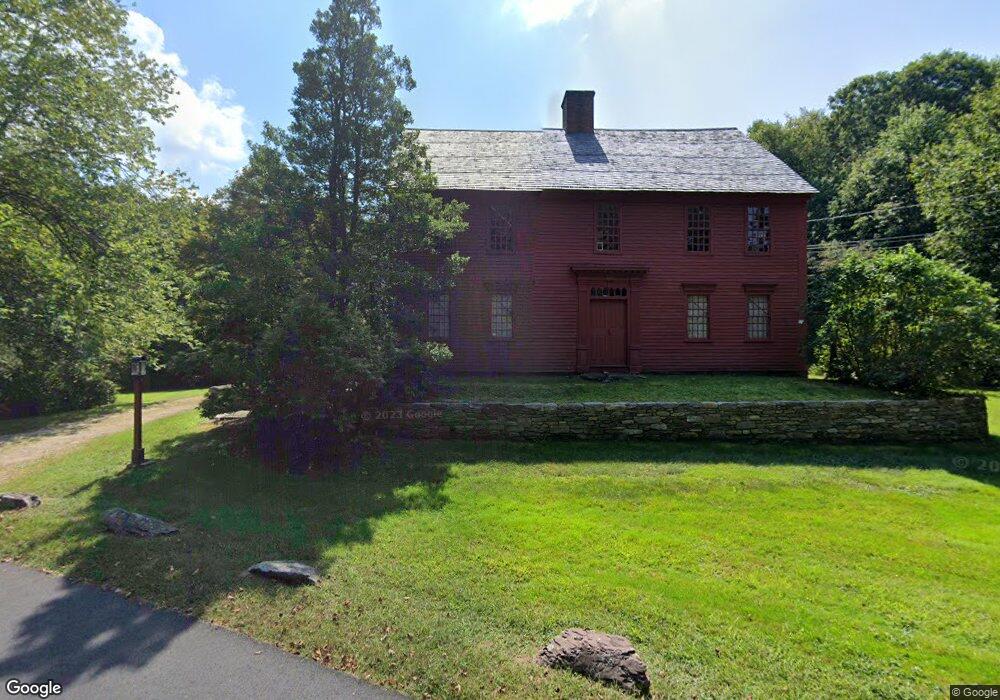
168 Weigold Rd Tolland, CT 06084
Estimated Value: $442,000 - $583,989
2
Beds
3
Baths
3,280
Sq Ft
$165/Sq Ft
Est. Value
About This Home
This home is located at 168 Weigold Rd, Tolland, CT 06084 and is currently estimated at $540,247, approximately $164 per square foot. 168 Weigold Rd is a home located in Tolland County with nearby schools including Birch Grove Primary School, Tolland Intermediate School, and Tolland Middle School.
Ownership History
Date
Name
Owned For
Owner Type
Purchase Details
Closed on
Dec 4, 1995
Sold by
Louring Wendy
Bought by
Laplante S Lee
Current Estimated Value
Home Financials for this Owner
Home Financials are based on the most recent Mortgage that was taken out on this home.
Original Mortgage
$80,000
Interest Rate
7.37%
Mortgage Type
Unknown
Purchase Details
Closed on
Sep 17, 1990
Sold by
Carlson Curtis
Bought by
Laplante S Lee
Home Financials for this Owner
Home Financials are based on the most recent Mortgage that was taken out on this home.
Original Mortgage
$68,000
Interest Rate
9.76%
Mortgage Type
Purchase Money Mortgage
Create a Home Valuation Report for This Property
The Home Valuation Report is an in-depth analysis detailing your home's value as well as a comparison with similar homes in the area
Home Values in the Area
Average Home Value in this Area
Purchase History
| Date | Buyer | Sale Price | Title Company |
|---|---|---|---|
| Laplante S Lee | $80,000 | -- | |
| Laplante S Lee | $80,000 | -- | |
| Laplante S Lee | $200,000 | -- |
Source: Public Records
Mortgage History
| Date | Status | Borrower | Loan Amount |
|---|---|---|---|
| Closed | Laplante S Lee | $80,000 | |
| Previous Owner | Laplante S Lee | $68,000 |
Source: Public Records
Tax History Compared to Growth
Tax History
| Year | Tax Paid | Tax Assessment Tax Assessment Total Assessment is a certain percentage of the fair market value that is determined by local assessors to be the total taxable value of land and additions on the property. | Land | Improvement |
|---|---|---|---|---|
| 2025 | $8,894 | $327,100 | $127,700 | $199,400 |
| 2024 | $8,755 | $231,800 | $102,500 | $129,300 |
| 2023 | $8,653 | $231,800 | $102,500 | $129,300 |
| 2022 | $8,479 | $231,800 | $102,500 | $129,300 |
| 2021 | $8,602 | $231,800 | $102,500 | $129,300 |
| 2020 | $8,356 | $231,800 | $102,500 | $129,300 |
| 2019 | $8,018 | $222,400 | $104,600 | $117,800 |
| 2018 | $7,784 | $222,400 | $104,600 | $117,800 |
| 2017 | $7,604 | $222,400 | $104,600 | $117,800 |
| 2016 | $7,604 | $222,400 | $104,600 | $117,800 |
| 2015 | $7,419 | $222,400 | $104,600 | $117,800 |
| 2014 | $7,530 | $242,500 | $116,100 | $126,400 |
Source: Public Records
Map
Nearby Homes